
While the KuCoin Token (KCS) price shows signs that often lead to a bounce, the long-term readings remain bearish.
Despite this pessimistic outlook, the price may undergo an initial rally before resuming its previous downward trend.
KCS Price Fails to Clear Long-Term Resistance
The KCS price has fallen under a long-term descending resistance line since reaching an all-time high price of $28,77 in Nov. 2021. So far, the line has been in place for 546 days. So, the trend is considered bearish as long as the price trades below it.
While following the line, KCS fell to a low of $5.55. The creation of a long lower wick (green icon) and the ensuing bounce validated the $6.60 horizontal area as support.
More recently, the line caused a rejection on April 23, catalyzing the current decrease.
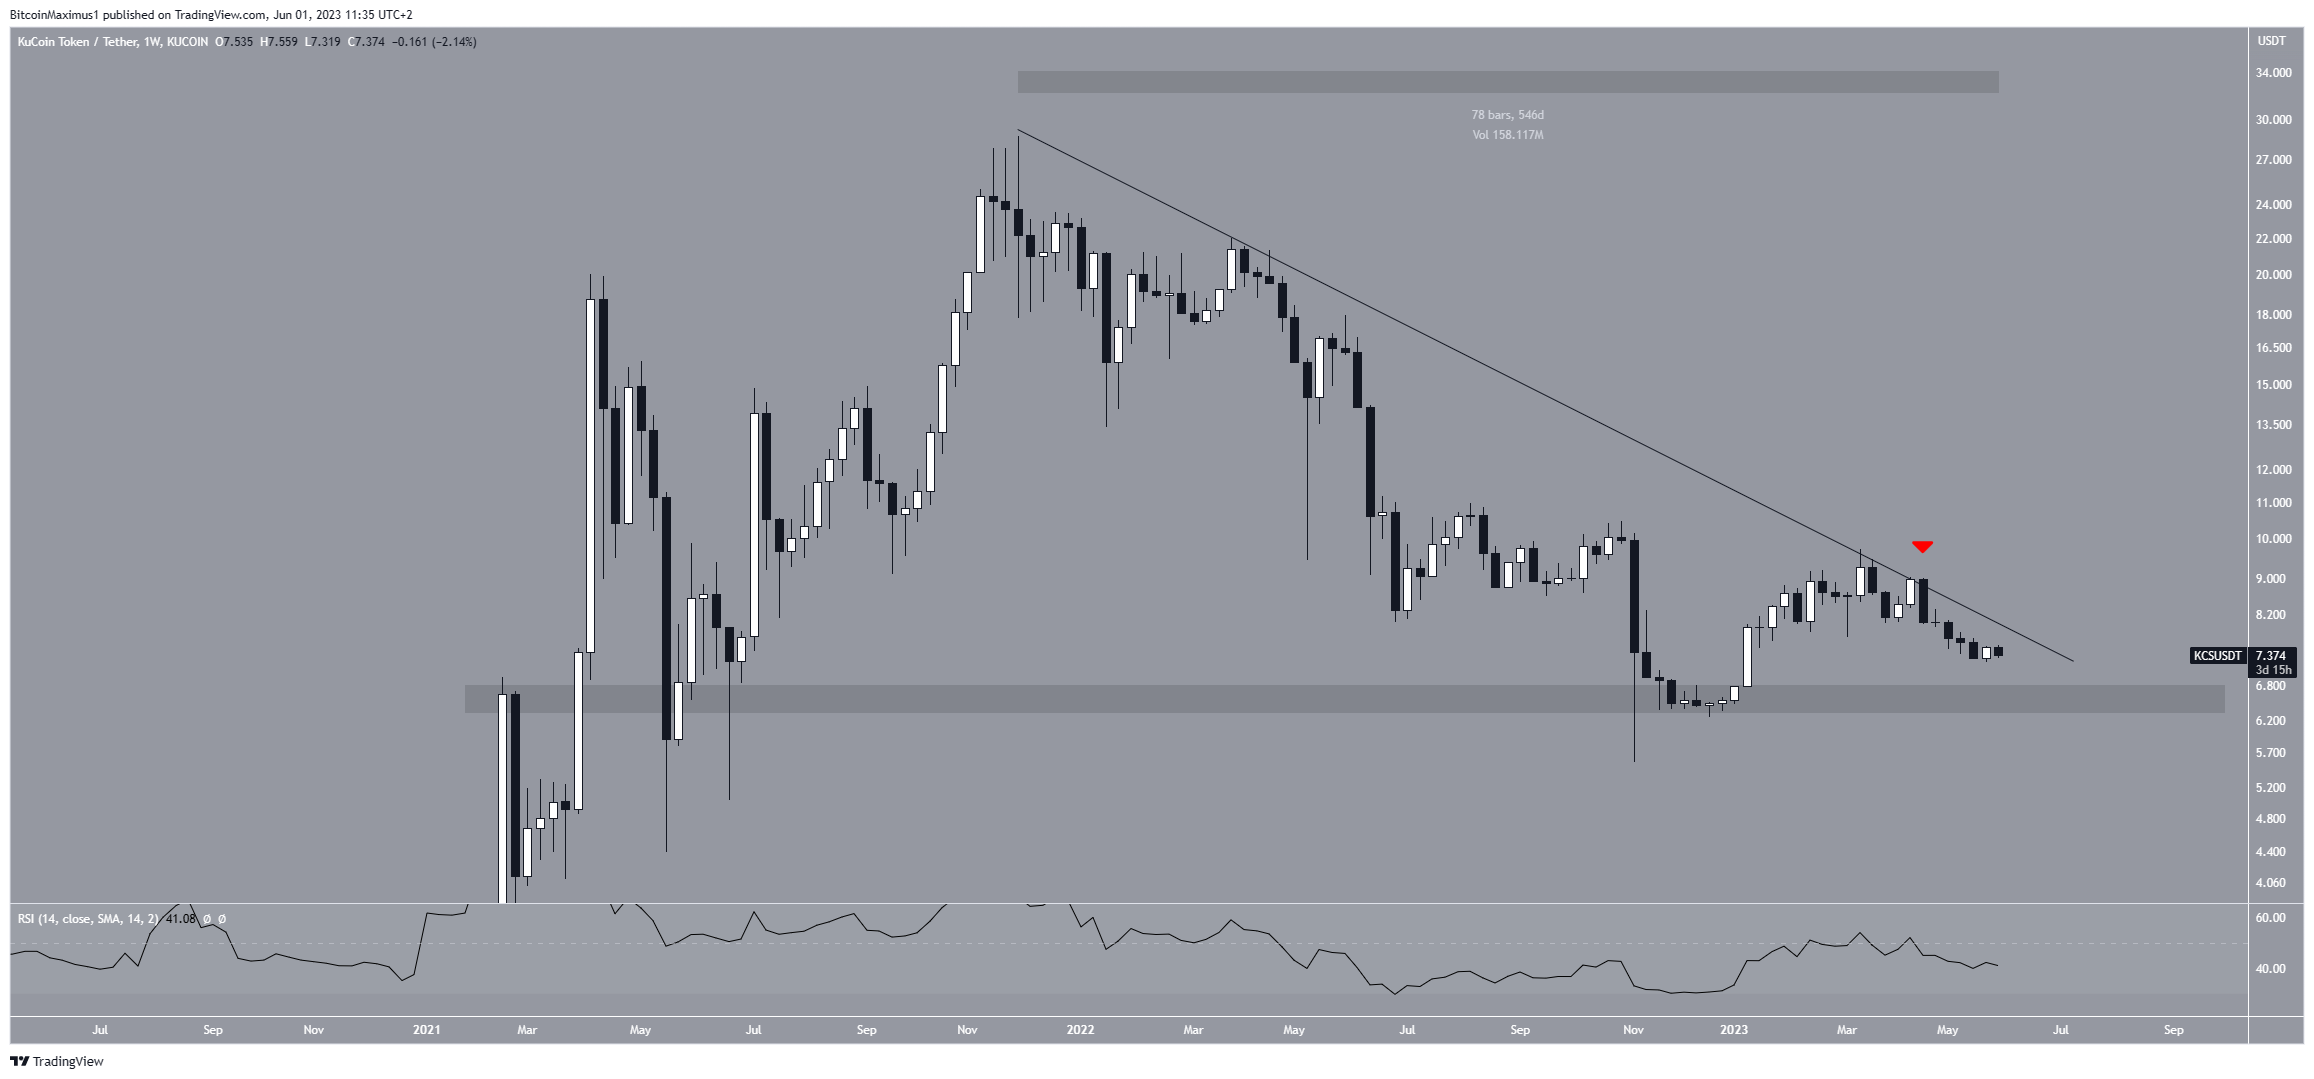
The weekly RSI supports the continuation of the decrease. The RSI is a momentum indicator used by traders to evaluate whether a market is overbought or oversold
Go to Source to See Full Article
Author: Valdrin Tahiri
Tip BTC Newswire with Cryptocurrency
Donate Bitcoin to BTC Newswire

Donate Bitcoin Cash to BTC Newswire

Donate Ethereum to BTC Newswire

Donate Litecoin to BTC Newswire

Donate Monero to BTC Newswire

Donate ZCash to BTC Newswire


