Disclaimer: The information presented does not constitute financial, investment, trading, or other types of advice and is solely the writer’s opinion.
- XRP possessed a bullish structure on the H4 and lower timeframe charts.
- The increase in demand over the past few days was an encouraging factor for the bulls.
Ripple [XRP] saw weakness from the buyers over the past two weeks as prices embarked on a downtrend. The bulls faced rejection from the $0.54 resistance region.
Read Ripple’s [XRP] Price Prediction 2023-24
In other news, Ripple replaced Circle [USDC] as the fifth member of the Hong Kong Virtual Asset Consortium [HKVAC]. Yet, the report also found that USDC had a much higher network growth than XRP.
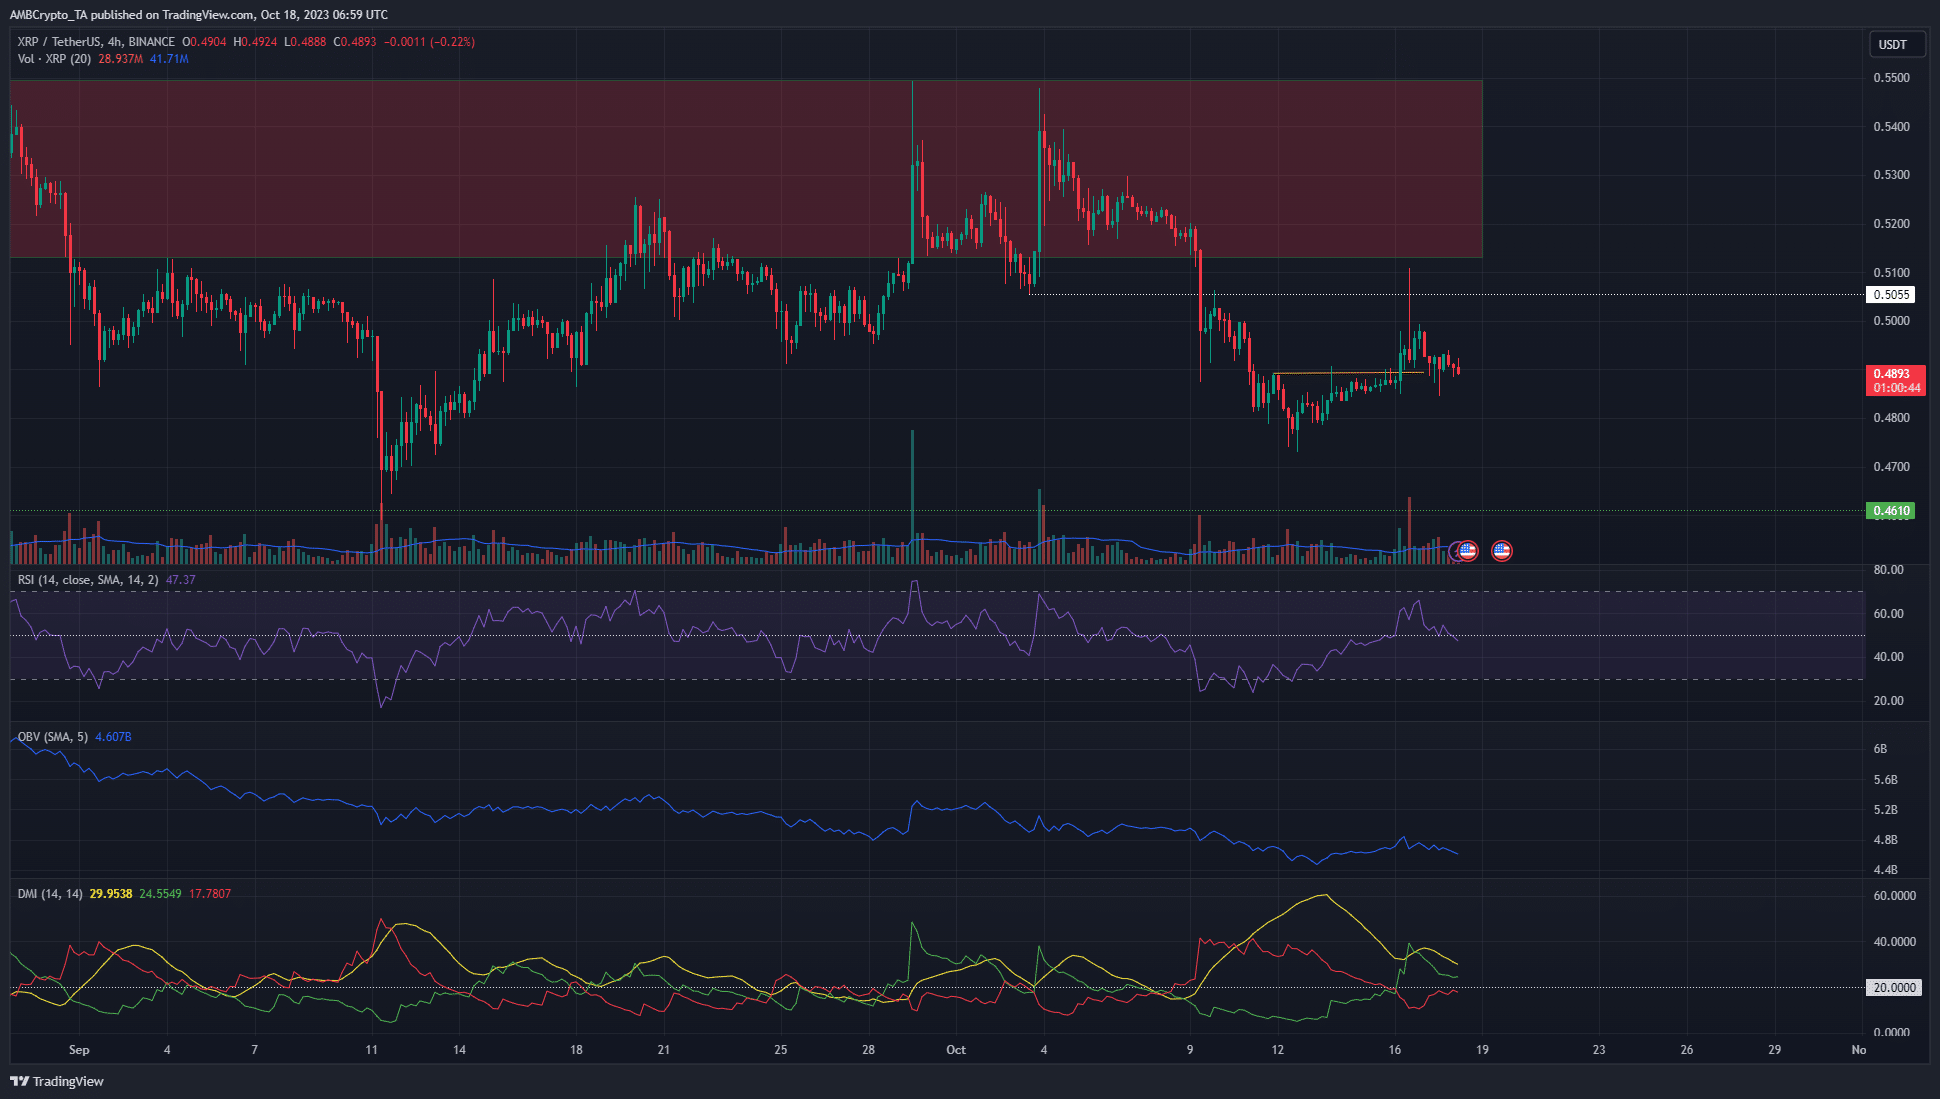
A technical analysis report from AMBCrypto dated 12 October drew attention to the bearish bias of XRP on the 1-day chart. It also highlighted the $0.46 as a critical support level. How do the lower timeframe charts look?
XRP’s rejection at $0.5 on Monday might be a precursor to further losses
The move above the recent lower high at $0.489 (orange) saw XRP flip its market structure bullishly. The RSI also climbed above neutral 50. The DMI saw both the ADX (yellow) and +DI (green) jump above 20.
Hence, the factors reflected strong bullish sentiment just 30 hours before the time of writing. Yet, things have begun to change. The OBV has been in a downtrend throughout October, and
Go to Source to See Full Article
Author: Akashnath S
Tip BTC Newswire with Cryptocurrency
Donate Bitcoin to BTC Newswire

Donate Bitcoin Cash to BTC Newswire

Donate Ethereum to BTC Newswire

Donate Litecoin to BTC Newswire

Donate Monero to BTC Newswire

Donate ZCash to BTC Newswire


