
The Stellar (XLM) price has fallen since the beginning of April. It lost a crucial horizontal area during the downward movement.
However, while the long-term readings are bearish, the short-term chart suggests that a bounce could transpire soon.
Stellar Price Might Have Completed Correction
The technical analysis from the daily time frame shows that the XLM price has fallen since reaching a yearly high of $0.11 on April 1.
During the fall, XLM fell below the $0.095 area, which was expected to provide support. The area will likely provide resistance in the future.
The decrease since the high resembles a five-wave downward movement (black). If so, XLM is currently in the fifth and final wave of the decrease. Since the preceding increase was an A-B-C corrective structure (white), the wave count suggests that the trend is bearish.
To determine the direction of a trend, technical analysts use the Elliott Wave theory, which involves studying recurring long-term price patterns and investor psychology.
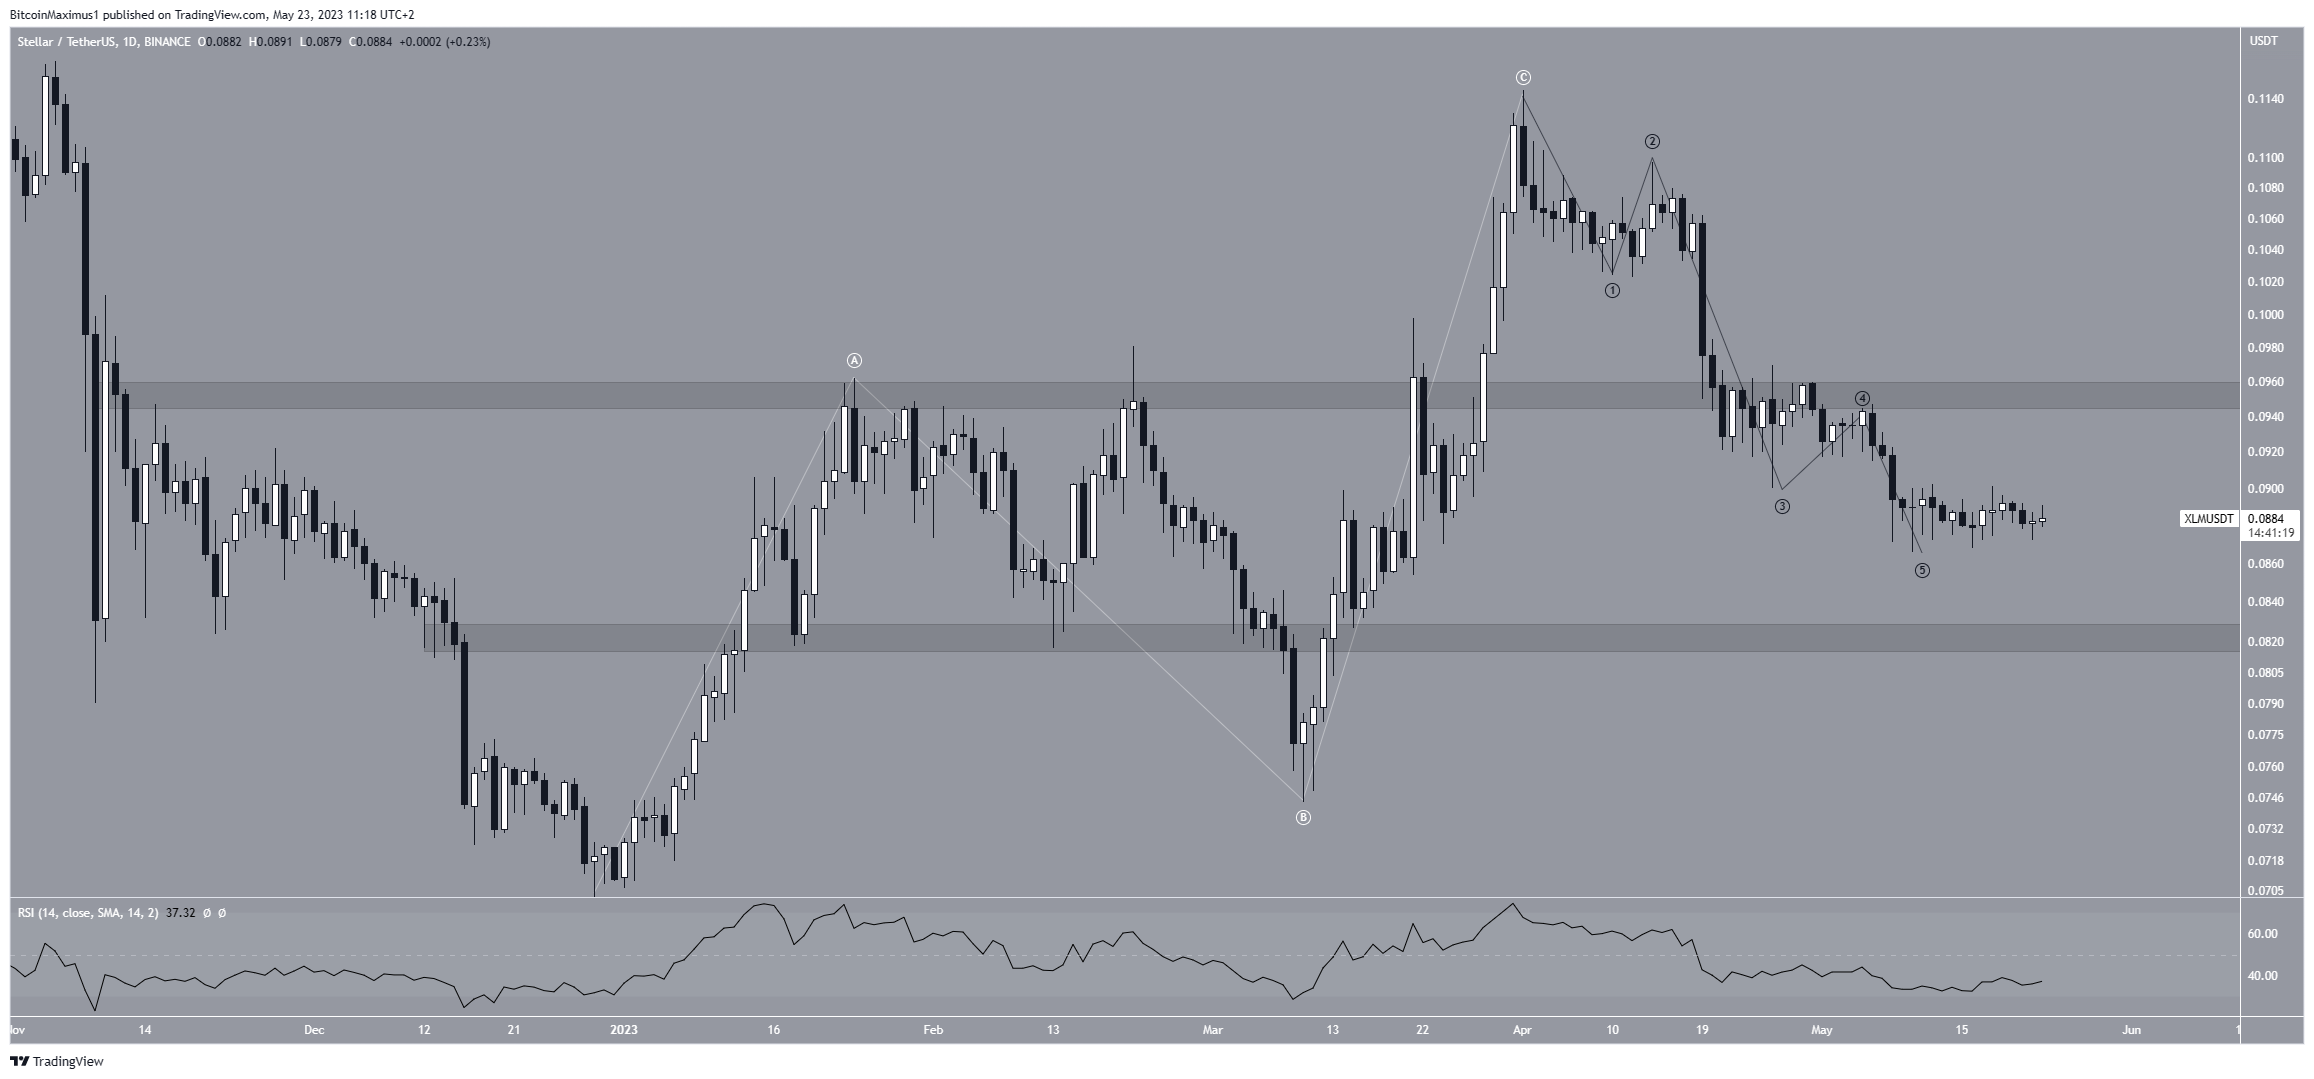
The Relative Strength Index (
Go to Source to See Full Article
Author: Valdrin Tahiri
Tip BTC Newswire with Cryptocurrency
Donate Bitcoin to BTC Newswire

Donate Bitcoin Cash to BTC Newswire

Donate Ethereum to BTC Newswire

Donate Litecoin to BTC Newswire

Donate Monero to BTC Newswire

Donate ZCash to BTC Newswire


