
The Polygon (MATIC) price may be potentially ending its correction phase and may be poised for a new upward movement.
Currently, MATIC is encountering a significant Fibonacci resistance level. If Polygon manages to break through this resistance, it could signal the potential for further price gains.
Polygon Eyes Breakthrough: Can It Surpass $0.821, the 0.382 Fib Level?
The Polygon (MATIC) price has experienced a significant increase over the past five days, bringing it to the 0.382 Fibonacci resistance level at approximately $0.821.
If MATIC manages to break through this resistance, its next potential target could be the golden ratio level around $0.89. A successful break above this level could indicate the end of the corrective movement and open the path for MATIC to target or even surpass its previous high at approximately $0.98.
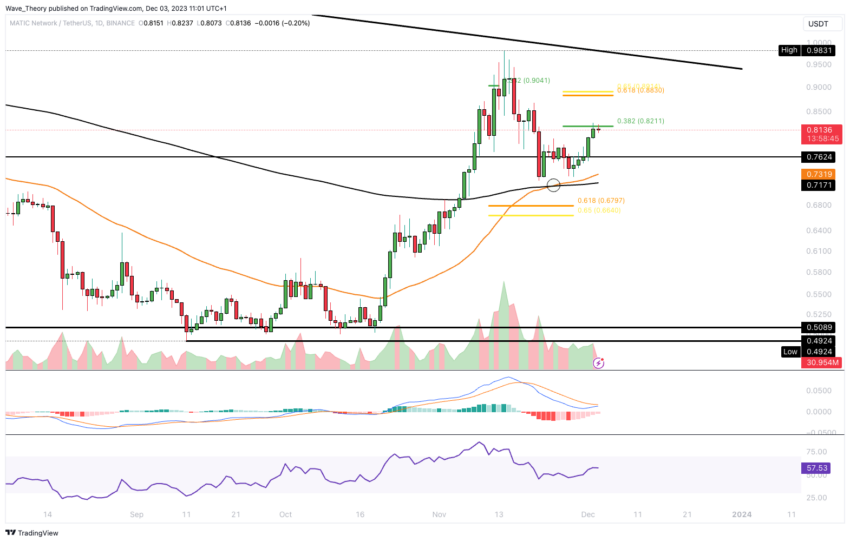
Furthermore, in the daily chart, the MACD (Moving Average Convergence Divergence) lines are on the verge of forming a bullish crossover. The MACD histogram has been trending higher in a bullish manner for several days, and the RSI (Relative Strength Index) is currently in neutral territory.
Additionally, the EMAs (Exponential Moving Averages) have formed a golden crossover, confirming the short to medium-term bullish trend.
4H Chart Analysis: Mixed Signals Emerge From Key Indicators
In the 4-hour chart, Polygon (MATIC) has also experienced a golden crossover of the Exponential Moving Averages (EMAs), confirming a bullish trend in the short term. However, it’s important to note that the Relative Strength Index (RSI) is approaching overbough
Go to Source to See Full Article
Author: Ryan James
Tip BTC Newswire with Cryptocurrency
Donate Bitcoin to BTC Newswire

Donate Bitcoin Cash to BTC Newswire

Donate Ethereum to BTC Newswire

Donate Litecoin to BTC Newswire

Donate Monero to BTC Newswire

Donate ZCash to BTC Newswire


