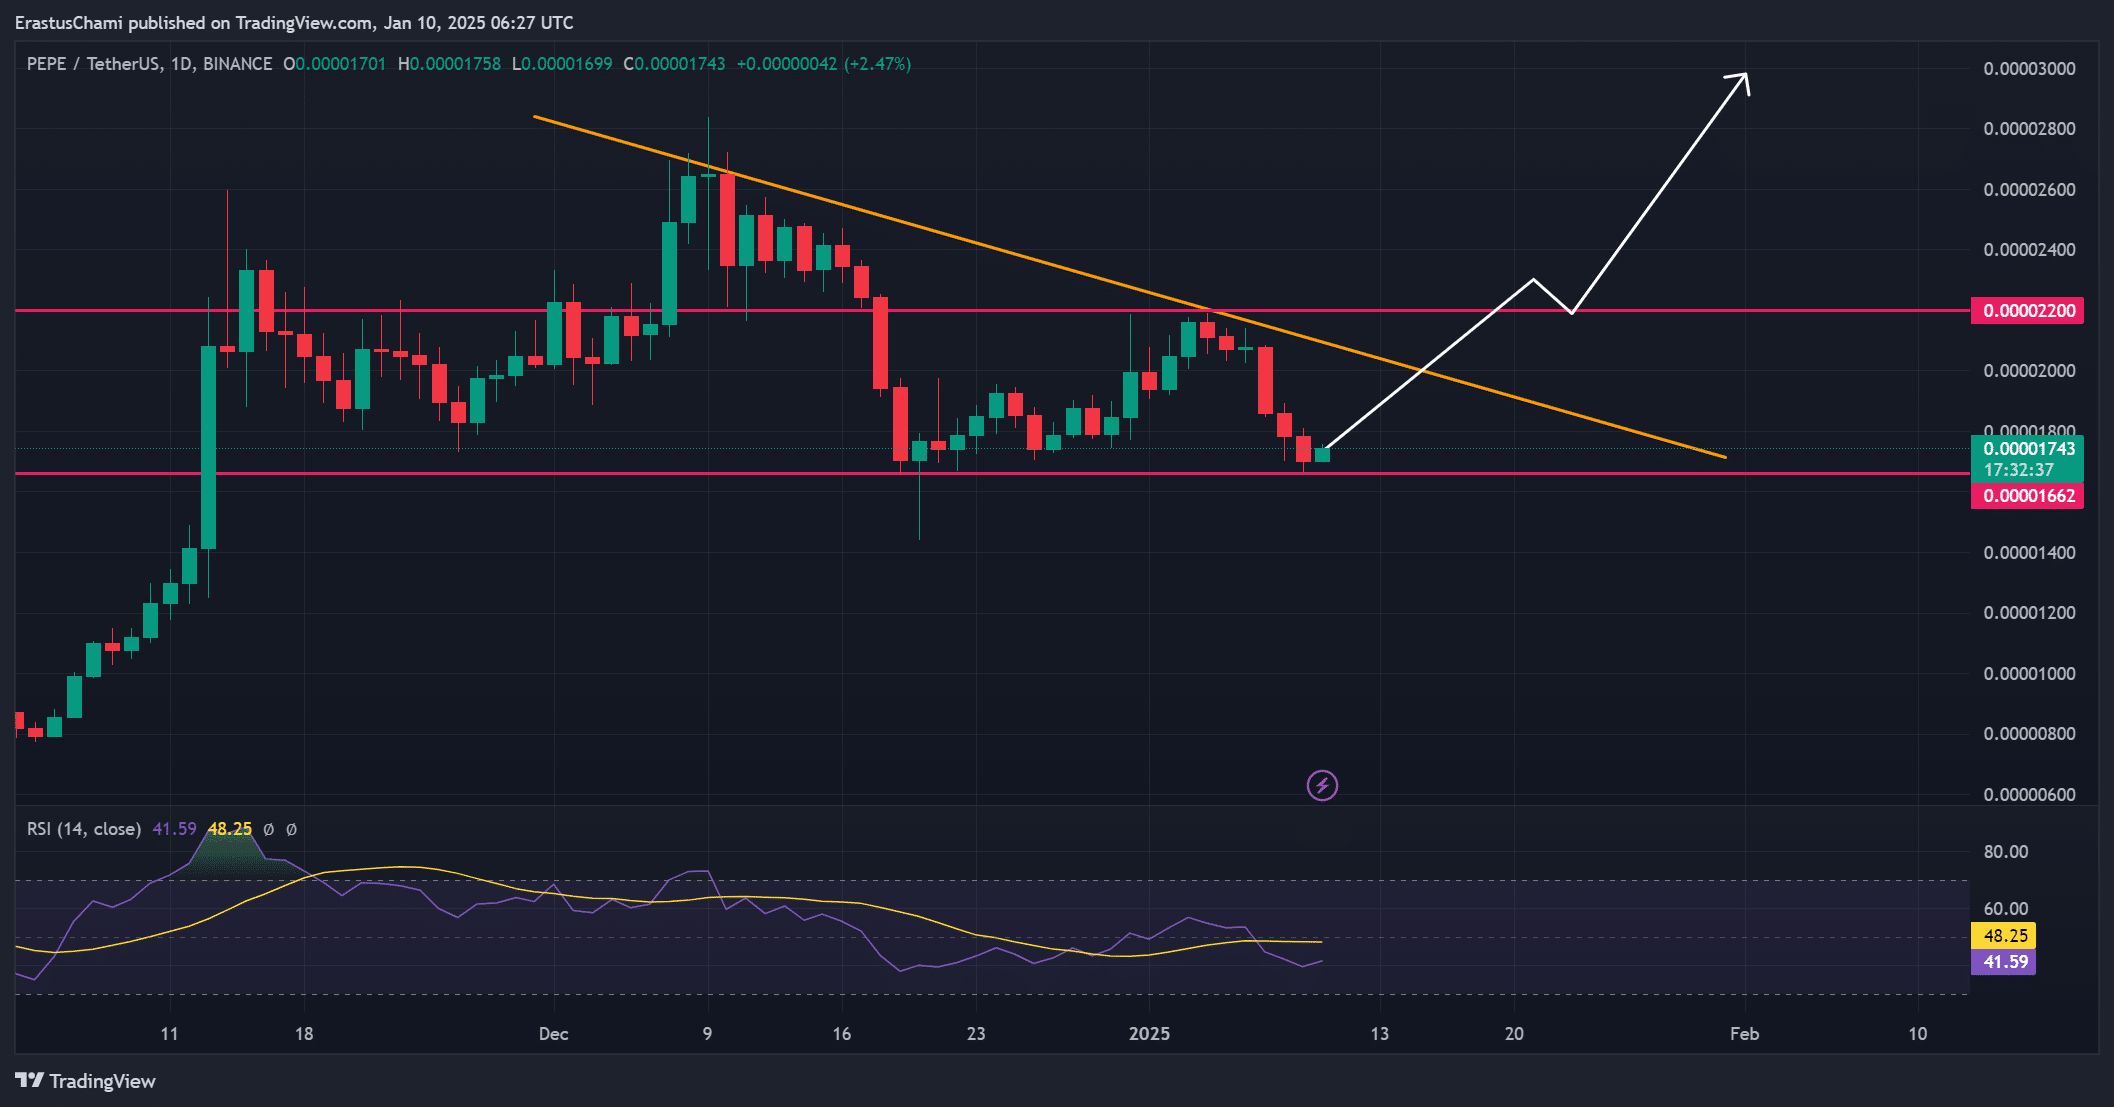
- PEPE seemed to be trading near its support with low RSI as it faces key resistance at $0.00002200
- Retail-driven transactions and liquidation imbalances hinted at potential short-term volatility and recovery
On 04 January Pepe [PEPE] faced a 20% price correction after the TD Sequential indicator flashed a sell signal on its 12-hour chart. However, the same indicator is now presenting a buy signal, sparking optimism for a potential recovery.
At press time, PEPE was trading at $0.00001745, following a 1.89% fall in the last 24 hours. Consequently, traders are closely watching key resistance levels to determine whether PEPE can regain bullish momentum and avoid further consolidation on the charts.
Source: X/Ali
Can PEPE overcome resistance and reignite momentum?
PEPE seemed to be holding above its crucial $0.00001662 support level – Pivotal for any potential upward movement. Additionally, the next major resistance lay at $0.00002200, which traders must monitor closely. The Relative Strength Index (RSI) was at 41.59, suggesting that the token was in an oversold condition.
Therefore, buyers might see this as an opportunity to accumulate, but breaking the descending trendline remains critical to confirm bullish momentum. However, failure to its maintain support could trigger another downward leg.
Go to Source to See Full Article
Author: Erastus Chami