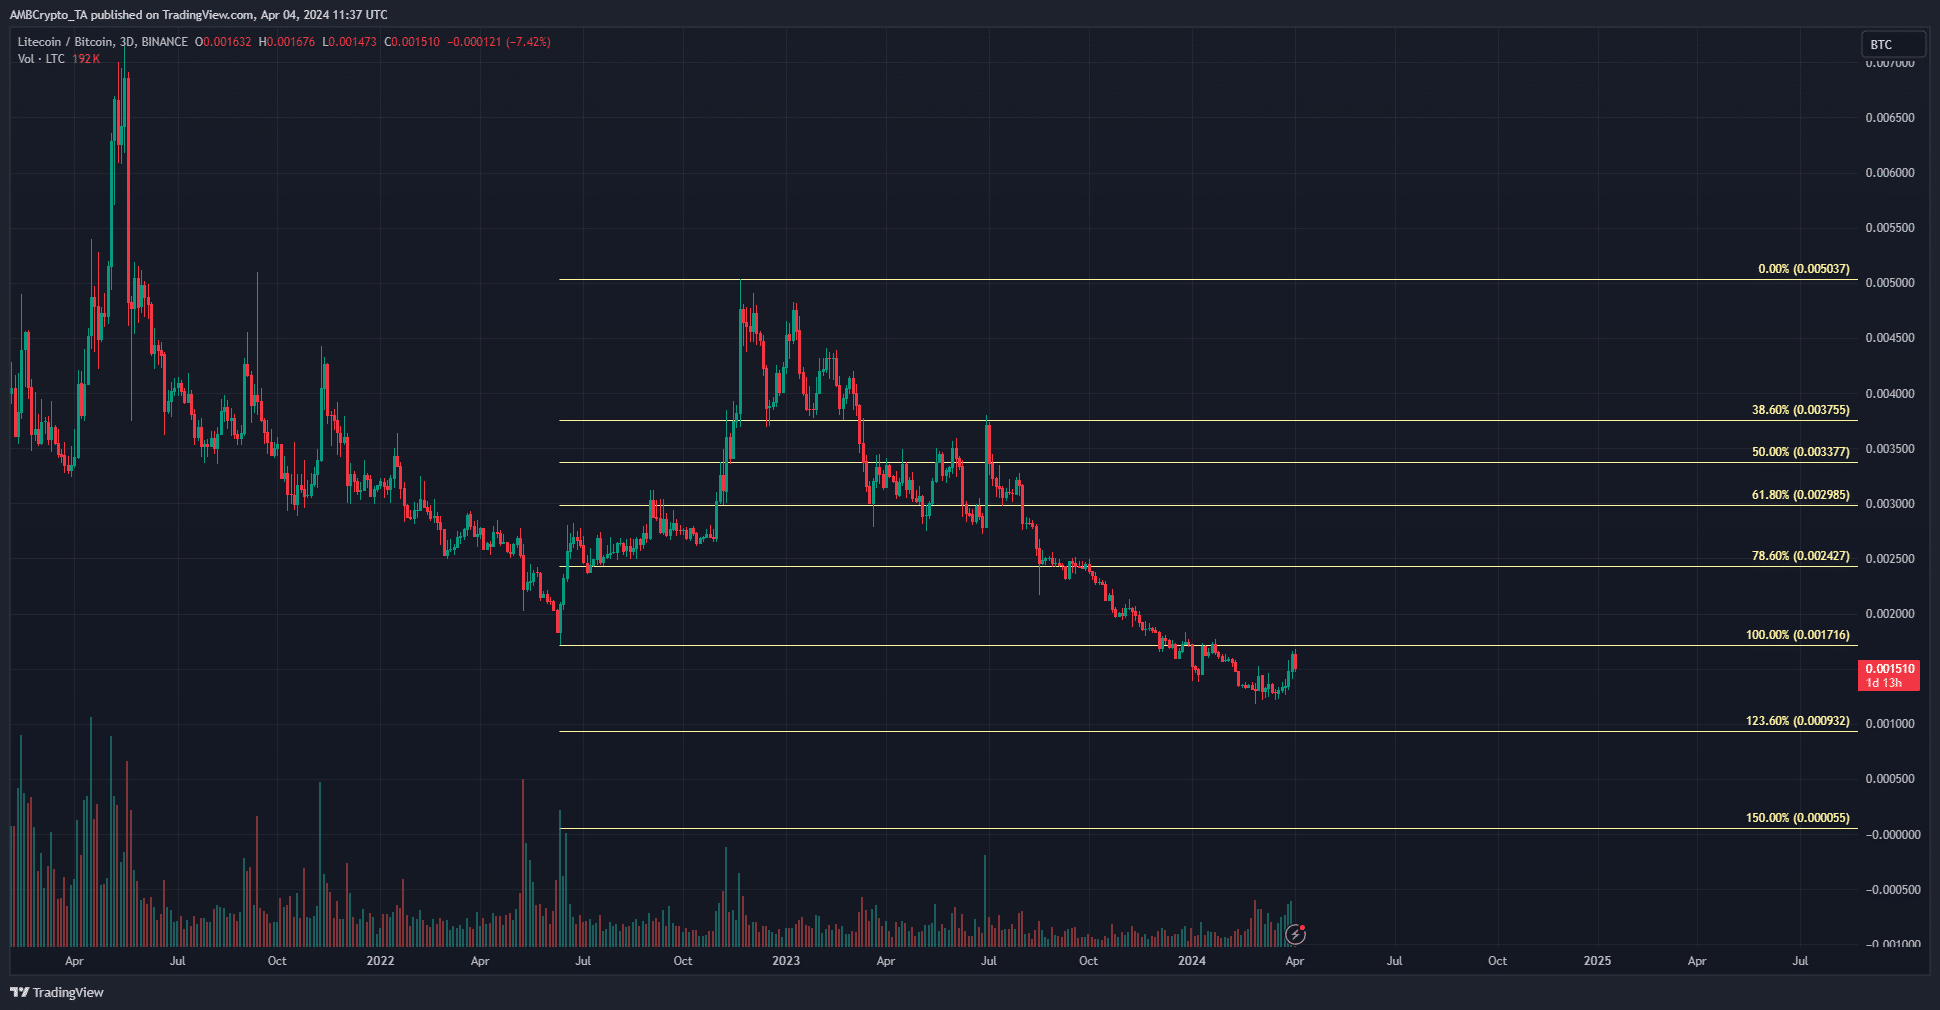
- The Litecoin/Tether chart was completely different to the Litecoin/Bitcoin chart
- Investors would be debating whether LTC could catch up to BTC’s performance this year
Litecoin [LTC] performed well on the 2nd of April, leading a rally while Bitcoin [BTC] prices continued to slump. However, later that day, LTC went on to retrace almost all the gains made a few hours earlier.
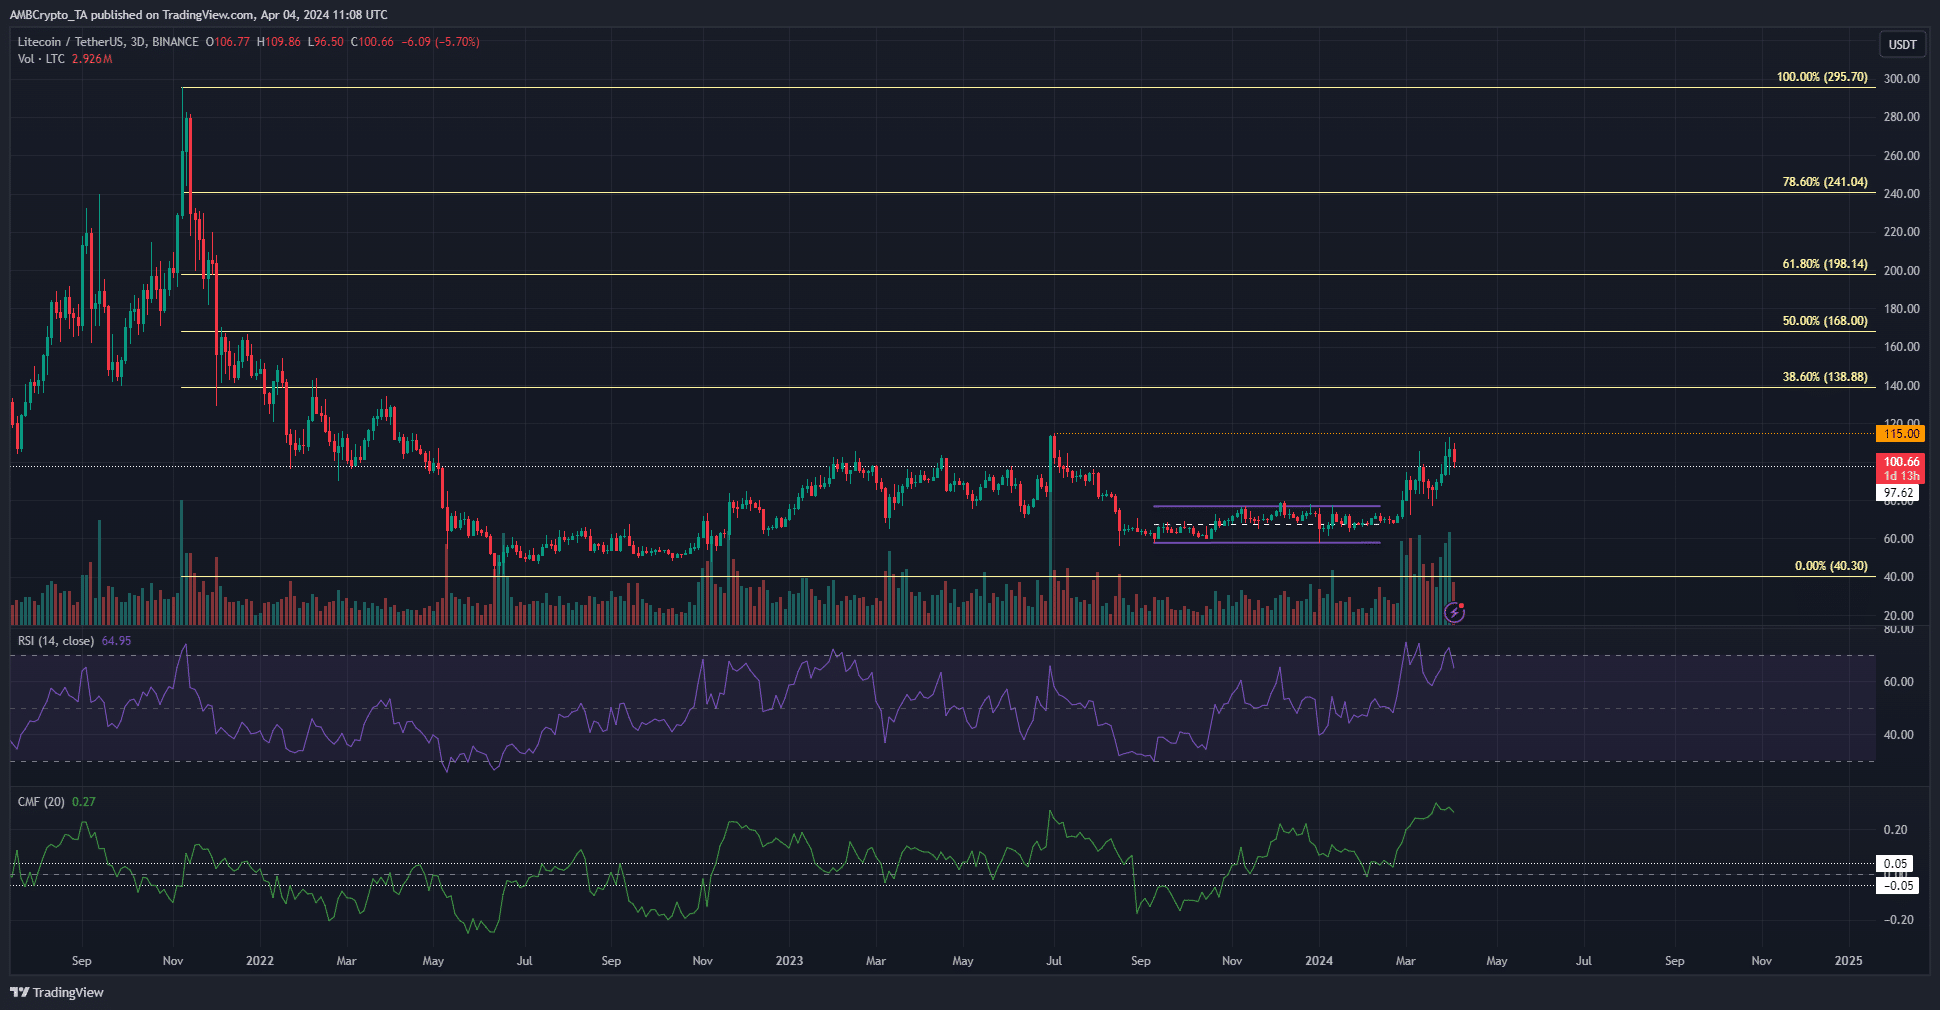
However, the near 15% bounce from $95.6 to $109.86 occurred on a heavy bout of trading volume. It gave investors hope that LTC could have begun an uptrend.
Examining the HTF price action- has Litecoin initiated an uptrend?
The breakout past the Q4 2023 range (purple) highs at $79.5 flipped the D3 structure bullishly. The technical indicators on the 3-day chart were firmly positive. The trading volume, as mentioned, was consistently higher than it has been throughout 2023 (with one exception- the 30th of June).
The D3 RSI and the CMF also noted strength from bulls in March. Together they showed significant capital flow into the LTC market. This has propelled prices higher in recent weeks.
It was hugely encouraging that the $80 level was retested as support in early March. The fact that the bulls were able to defend it indicated buyers were adamant.
A look at the weekly chart showed that a move past $115 would show a bullish market structure on the 1-week chart. If LTC bulls achieve that, the price action from May 2022 to press time would have been a lengthy preamble, a consolidation phase, before the next bull run.
How does Litecoin stack up against Bitcoin?
Go to Source to See Full Article
Author: Akashnath S
Tip BTC Newswire with Cryptocurrency
Donate Bitcoin to BTC Newswire

Donate Bitcoin Cash to BTC Newswire

Donate Ethereum to BTC Newswire

Donate Litecoin to BTC Newswire

Donate Monero to BTC Newswire

Donate ZCash to BTC Newswire


