Disclaimer: The information presented does not constitute financial, investment, trading, or other types of advice.
- Asset showed some weakness on the price charts after falling below $0.24 in March
- Momentum was neutral with capital inflows, but it was likely that IOTA prices could go lower
IOTA (IOTA/USD) has recorded a rollercoaster ride in terms of price fluctuations over the past year. The token was trading at $0.79 on 1 March 2022, $0.169 on 1 January 2023, and $0.242 on 1 March 2023.
Realistic or not, here’s IOTA’s market cap in BTC’s terms
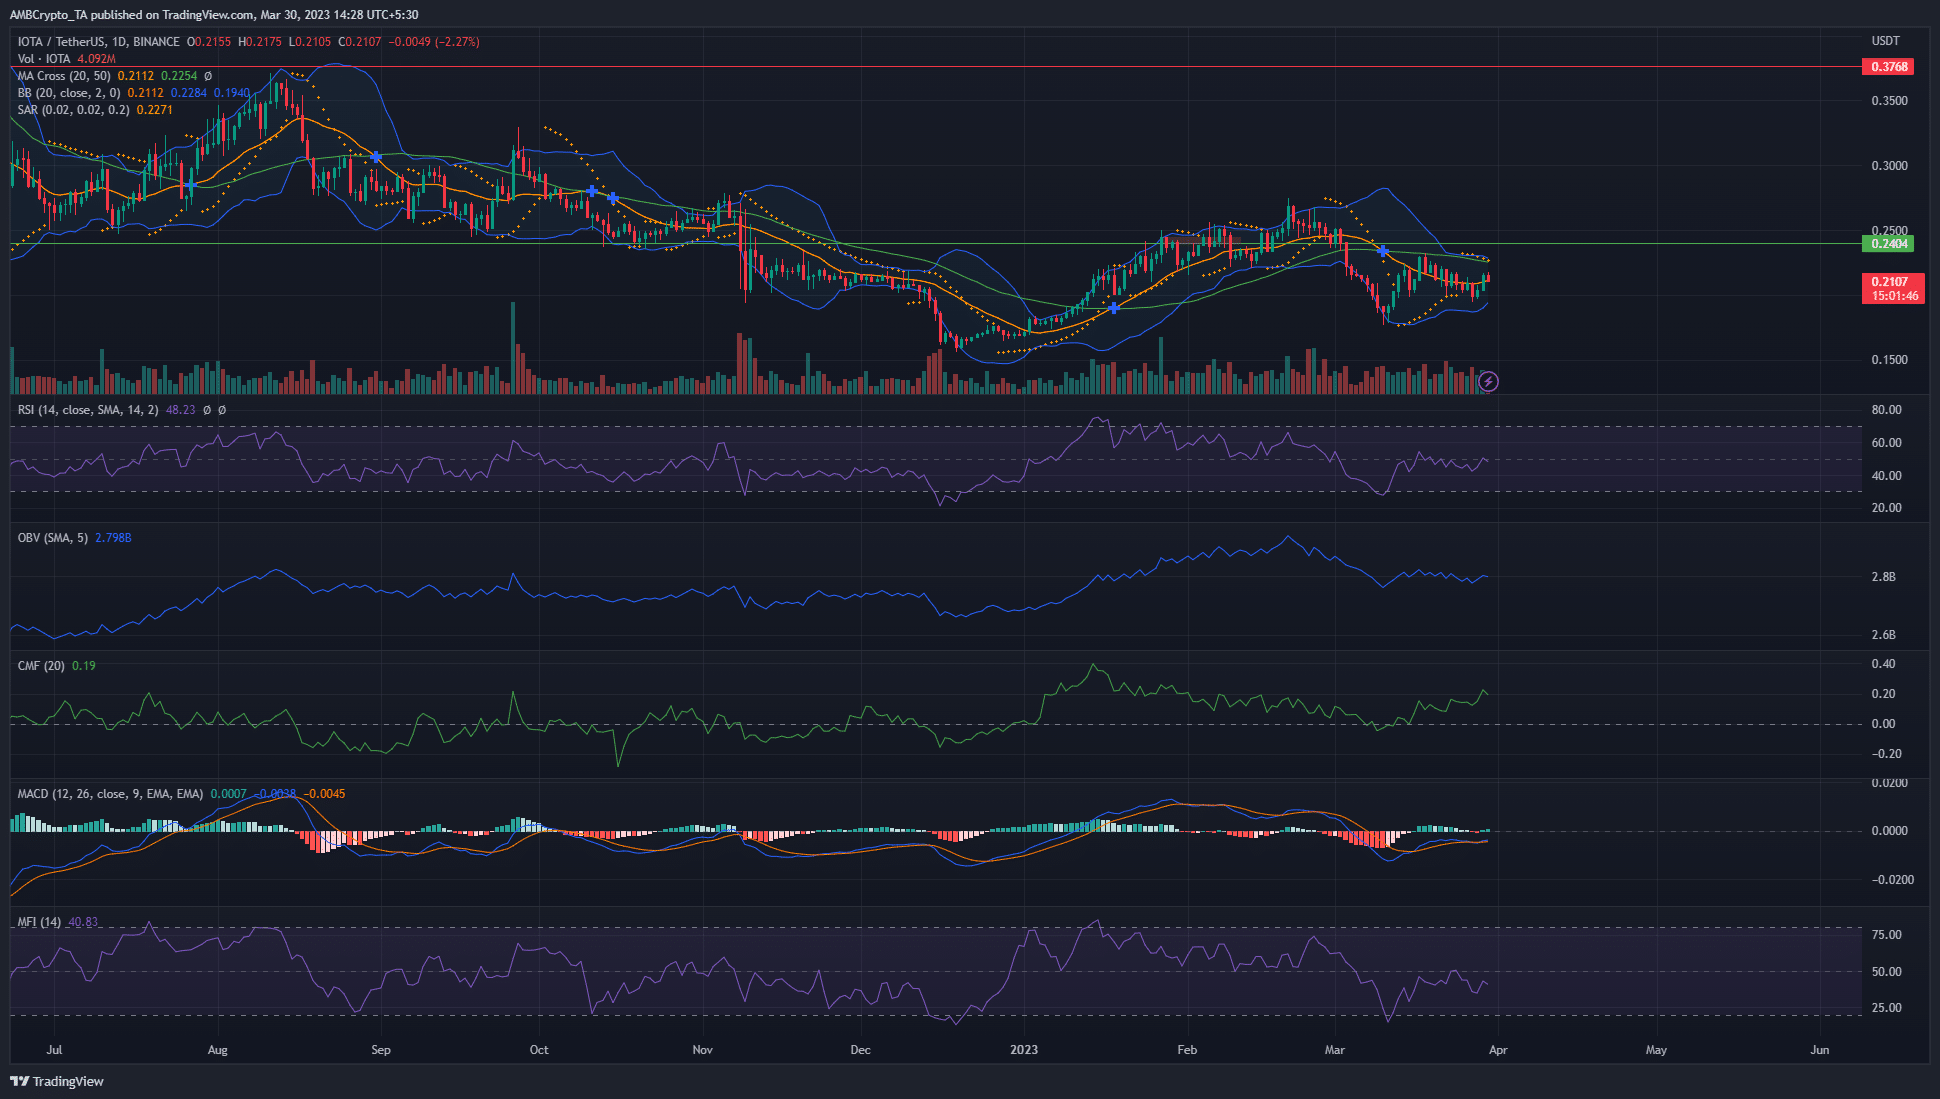
At press time, IOTA/USD was valued at $0.211 after posting 6% gains in the last 24 hours, retracing from $0.217 to $0.211. This analysis will examine key technical indicators on the 1-day timeframe, including the Relative Strength Index (RSI), Bollinger Bands, On-Balance Volume (OBV), Chaikin Money Flow (CMF), Moving Averages, MACD, Money Flow Index (MFI), and Parabolic SAR.
Analysis showed a downtrend could begin for IOTA under this support level
IOTA is a crypto token that has a positive correlation with Bitcoin (BTC) on the price charts. With Bitcoin facing strong resistance at $28.7K, IOTA could record a pullback. The market sentiment has been bullish in March, but there’s a possibility of a correction south for both BTC and IOTA.
Key Highlights –
- RSI at 48.3, reflecting neutral market sentiment
- Bollinger Bands converging, indicating a potential price breakout
- OBV at 2.8 billion, flat for the past two weeks
- CMF at +0.19, suggesting strong buying pressure
- Moving Averages: 20 SMA at 0.211, 50 SMA at 0.225
- MACD below zero line and formed a bearish crossover
- MFI at 40.8, indicating bearish momentum
- Parabolic SAR’s dots were above price candles, signalling a short-term bearish trend
- Significant support levels: $0.2035 and $0.178
- Significant resistance levels: $0.24 and $0.277
Go to Source to See Full Article
Author: Akashnath S
Tip BTC Newswire with Cryptocurrency
Donate Bitcoin to BTC Newswire

Donate Bitcoin Cash to BTC Newswire

Donate Ethereum to BTC Newswire

Donate Litecoin to BTC Newswire

Donate Monero to BTC Newswire

Donate ZCash to BTC Newswire


