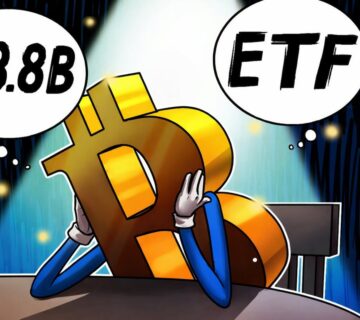
Bitcoin gained fresh BTC price crash predictions as it fell to $85,000 in flash volatility at the monthly close amid a lack of liquidity.
Markets News
Bitcoin (BTC) threatens a fresh crash as December begins with a snap 5% BTC price drawdown.
-
Bitcoin price volatility hits around the November monthly close, with BTC/USD falling to near $85,000.
-
Analysis blames a lack of market liquidity, while history warns that bearishness may continue in December.
-
Key US inflation data is due as markets preserve Fed rate-cut bets despite concerns over Japan.
-
The Coinbase Premium may have ended its brief trip into “green” territory thanks to the BTC price dip.
-
Stablecoin dry powder hits all-time highs relative to BTC reserves on Binance.
Bitcoin “dead cat bounce” fields $50,000 target
Bitcoin price action went straight back to its pre-Thanksgiving range around the weekly and monthly close.
Data from Cointelegraph Markets Pro and TradingView confirms a classic “Bart Simpson” style chart pattern to start December.
Losses drove BTC/USD down to as low as $85,616 on Bitstamp before a modest bounce, while 24-hour liquidations stood at over $600 million at the time of writing, according to data from monitoring resource CoinGlass.
Reacting, some popular market participants were unsurprisingly bearish about what was to come. Trader Roman described a return to $50,000 as “inevitable.”
$BTC 1W
50k is inevitable.
Be ready to buy. pic.twitter.com/OkNCceCCbE
— Roman (@Roman_Trading) December 1, 2025
“Bitcoin needs to reclaim the $88,000-$89,000 level here; otherwise, it’ll drop towards the November low,” crypto investor and entrepreneur Ted Pillows warned in a post on X.
Examining long-term BTC price action, veteran trader Peter Brandt has even revived the idea of sub-$40,000 levels.
Last week, Brandt warned that Bitcoin’s recovery above $90,000 could constitute a “dead cat bounce,” one which he now suspects may be over.
Not to bust anyone’s banana, but the upper boundary of the lower green zone starts at sub $70s with lower boundary support in the mid $40s.
How soon before Saylor’s Shipmates ask about the life-boats? $BTC pic.twitter.com/YLfjSDdw9H— Peter Brandt (@PeterLBrandt) December 1, 2025
Meanwhile, more optimistic forecasts focus on a range-bound BTC/USD slowly reclaiming lost support levels.
“Overall: This could form a $80k – $99k range,” trader CrypNuevo concluded in his latest X thread.
CrypNuevo identified various key levels to flip, including the 50-week exponential moving average (EMA) and 2025 yearly open.
“My major concern is that we’re currently below the 1W50EMA which is a strong bull/bear market indicator. Could it be a deviation? Yes. There is past history of such deviations,” he wrote.
“Technically, I can’t support the bullish case until price is back above it ($99.8k).”
No “fundamental decline” in crypto
Bitcoin’s sudden dive just as the weekly and monthly candles closed concluded a grim month of downward volatility for bulls.
The latest data from CoinGlass confirmed that BTC/USD finished November down 17.7%, its worst performance since the 2018 bear market.
Q4 losses currently total 24.4%, placing Bitcoin on par with its decline from its previous highs of $20,000 seven years ago.
As Cointelegraph reported, history suggests that a “red” November leads to copycat performance in the last month of the year.
Commenting on the monthly close drama, trading resource The Kobeissi Letter pointed to system market weakness as a result of losses that had already locked in.
“As seen countless times this year, Friday night and Sunday night often come with LARGE crypto moves. Just now, we saw Bitcoin fall -$4,000 in a matter of minutes without ANY news at all,” it wrote in a dedicated X post on the topic.
“Why? Liquidity is thin.”
Kobeissi nonetheless repeated its idea that crypto’s technical bear market — the result of a more than 20% drop from all-time highs — remains “structural.”
“We do NOT view this a fundamental decline,” it stressed.
CoinGlass’s liquidation heatmap showed fresh asks being added overhead on spot markets, with $85,000 acting as a nearby area of support at the time of writing.
Eyes on Japan as “hawkish” mood returns
The Federal Reserve’s “preferred” inflation gauge is making a long-awaited comeback after months of delays caused by the US government shutdown.
The Personal Consumption Expenditures (PCE) index will give officials key insights into inflation trends at a key point in time; the Fed’s next interest-rate decision is less than two weeks away.
Markets remain upbeat on the outcome, with CME Group’s FedWatch Tool putting odds of a 0.25% cut at over 87% at the time of writing.
Jitters ahead of the weekly open, which saw US stock futures slip amid concerns over Japan’s financial stability, failed to dent the outlook.
“Japan’s 10Y Government Bond Yield surges to 1.84%, its highest level since April 2008,” The Kobeissi Letter wrote in an X post on the topic.
“This chart is concerning to say the least.”
Reacting to the latest market moves, Arthur Hayes, former CEO of crypto exchange BitMEX, pinned the blame for downward volatility firmly on the Bank of Japan (BOJ).
“$BTC dumped cause BOJ put Dec rate hike in play. USDJPY 155-160 makes BOJ hawkish,” he explained.
A Japanese rate hike would stand out conspicuously against an environment in which central banks continue to relax financial conditions.
“Financial conditions have eased over the last 2 years from one of the most restrictive levels since 2001. The move has been similar to the one seen following the 2008 Financial Crisis,” Kobeissi summarized at the weekend.
“This comes as over 90% of global central banks have either cut or kept rates unchanged over the last 12 months, the highest percentage since 2020-2021. World monetary policy has rarely ever been this loose.”
Coinbase Premium recovery on the edge
After the Thanksgiving holiday, the focus will shift to the first US trading session as traders assess US market demand for Bitcoin priced below $90,000.
The move down could have significant implications for the Coinbase premium, the crypto industry’s yardstick for US demand, which has only just flipped positive.
As Cointelegraph reported, the premium reflects the difference in price between Coinbase’s BTC/USD and Binance BTC/USDT pairs. A positive premium implies heightened buying during US trading hours, with the opposite often seen as a sign of overall crypto market weakness.
Data from onchain analytics platform CryptoQuant shows that the premium spent almost all of November in negative territory, only exiting during Thanksgiving.
Commenting, CryptoQuant contributor Cas Abbe had a potential silver lining for Bitcoin bulls.
“Some good signs of bottom are emerging now,” he told X followers over the weekend.
“Coinbase Bitcoin premium has been positive, despite BTC prices going down. This was one of the signs which started the reversal in April 2025.”
Abbe referred to Bitcoin’s trip below $75,000 in Q2 this year, an event that has so far marked a long-term BTC price floor.
Continuing, popular X account Against Wall Street argued that premium signals in both directions take time to play out.
“Notice something: just because the index turned red, we didn’t crash in a single day. And when it flips green, we’re not going to moon in a single day either,” part of a recent X post read.
“This is about trend. It’s about momentum shifting. That’s what you need to pay attention to.”
Stablecoin “dry powder” hits record
Amid nerves over the future of the crypto bull market, stablecoin trends point to a fresh round of mass capital deployment waiting in the wings.
Related: Bitcoin price slides to $85K: How low can BTC go in December?
CryptoQuant figures tracking stablecoin reserves on the largest global exchange, Binance, confirmed a new record over the past week.
Binance’s ratio of stablecoins versus its BTC reserves has never been more skewed in favor of the former.
“This freefall indicates an unprecedented accumulation of ‘buying power,’ contributor CryptoOnChain commented in a Quicktake blog post Monday.
“Currently, the volume of stablecoins parked on Binance (dry powder) relative to available Bitcoin is at its highest level in over 6 years.”
The post referenced stablecoin liquidity as a method of quick capital deployment in the event of a market turnaround, implying enduring faith in such a move eventually taking place.
“When the scale tips this heavily in favor of stablecoins, it means the market is ‘locked and loaded,’” CryptoOnChain concluded alongside a print of the stablecoin ratio.
“As the green bars on the chart suggest, history shows that hitting such lows often precedes powerful Bitcoin rallies, simply because the liquidity required to fuel a price surge is now fully available on the exchange.”
This article does not contain investment advice or recommendations. Every investment and trading move involves risk, and readers should conduct their own research when making a decision.
Go to Source to See Full Article
Author: William Suberg