
Hyperliquid [HYPE] exhibited bullish strength in recent trading days. Last week, HYPE dropped to a low of $25.63 on Monday, the 23rd of February. Since then, the DEX token has rallied by 19.73%.
AMBCrypto had reported that the pullback to the $25 demand zone was a buying opportunity.
A move below $23.4 and $20 would be the warning signs to exit long positions. These levels remain untouched by the bears, showing HYPE strength.
The underlying market fundamentals were strong, and the longer-term Hyperliquid price action had a bullish bias. Here’s what traders can expect the following week.
Mapping the HYPE short-term price trends
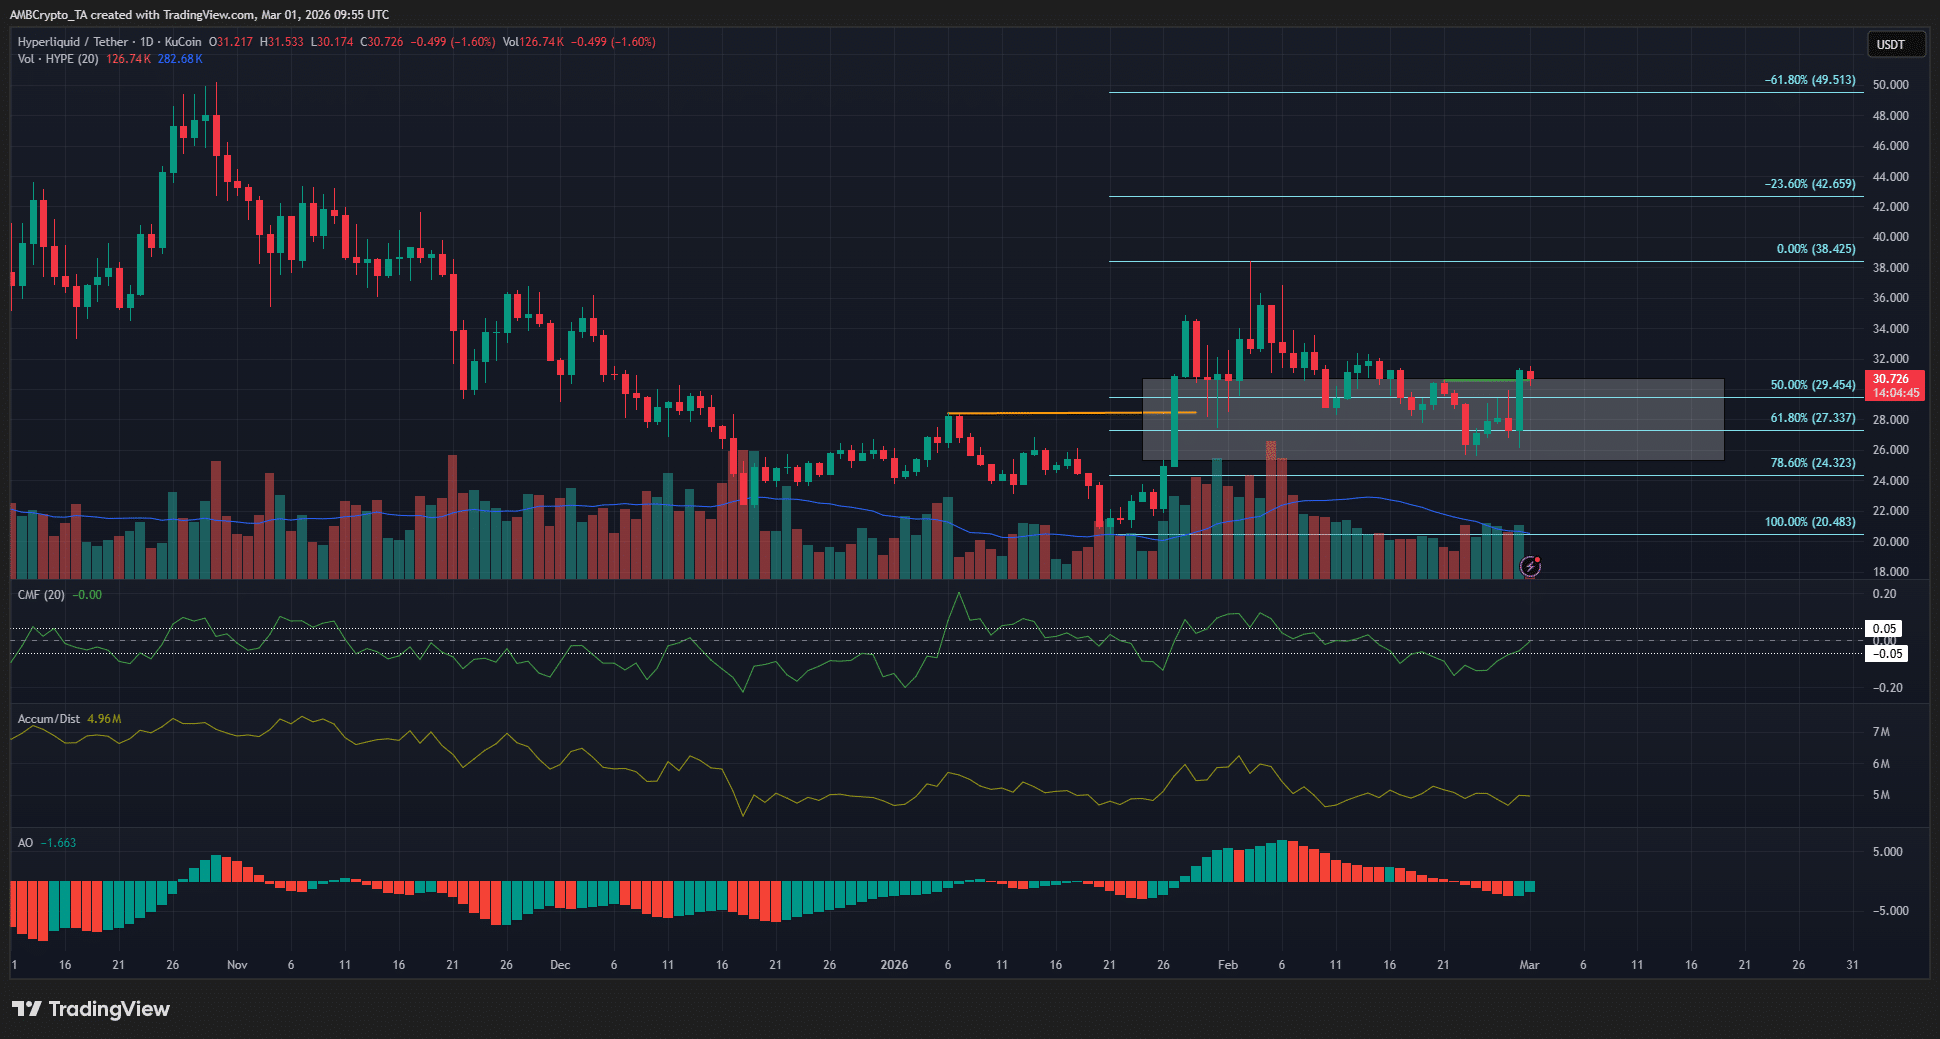
Source: HYPE/USDT on TradingView
The 1-day chart saw a bullish swing structure shift (orange) toward the end of January. The subsequent retracement reached the 61.8% Fibonacci retracement level. From this support, the internal structure break (green) occurred.
The price action was aligning with the bulls. It was the time to buy, though the daily timeframe indicators reflected a neutral bias or even bearishness.
The CMF was at 0 (zero), while the A/D indicator was unable to reach new highs. Together, the volume indicators signaled a lack of buying strength. Meanwhile, the Awesome Oscillator was moving below the zero line.
Yet, traders should remember that the price action leads while most indicators follow, or lag.
Traders’ call to action – Buy!
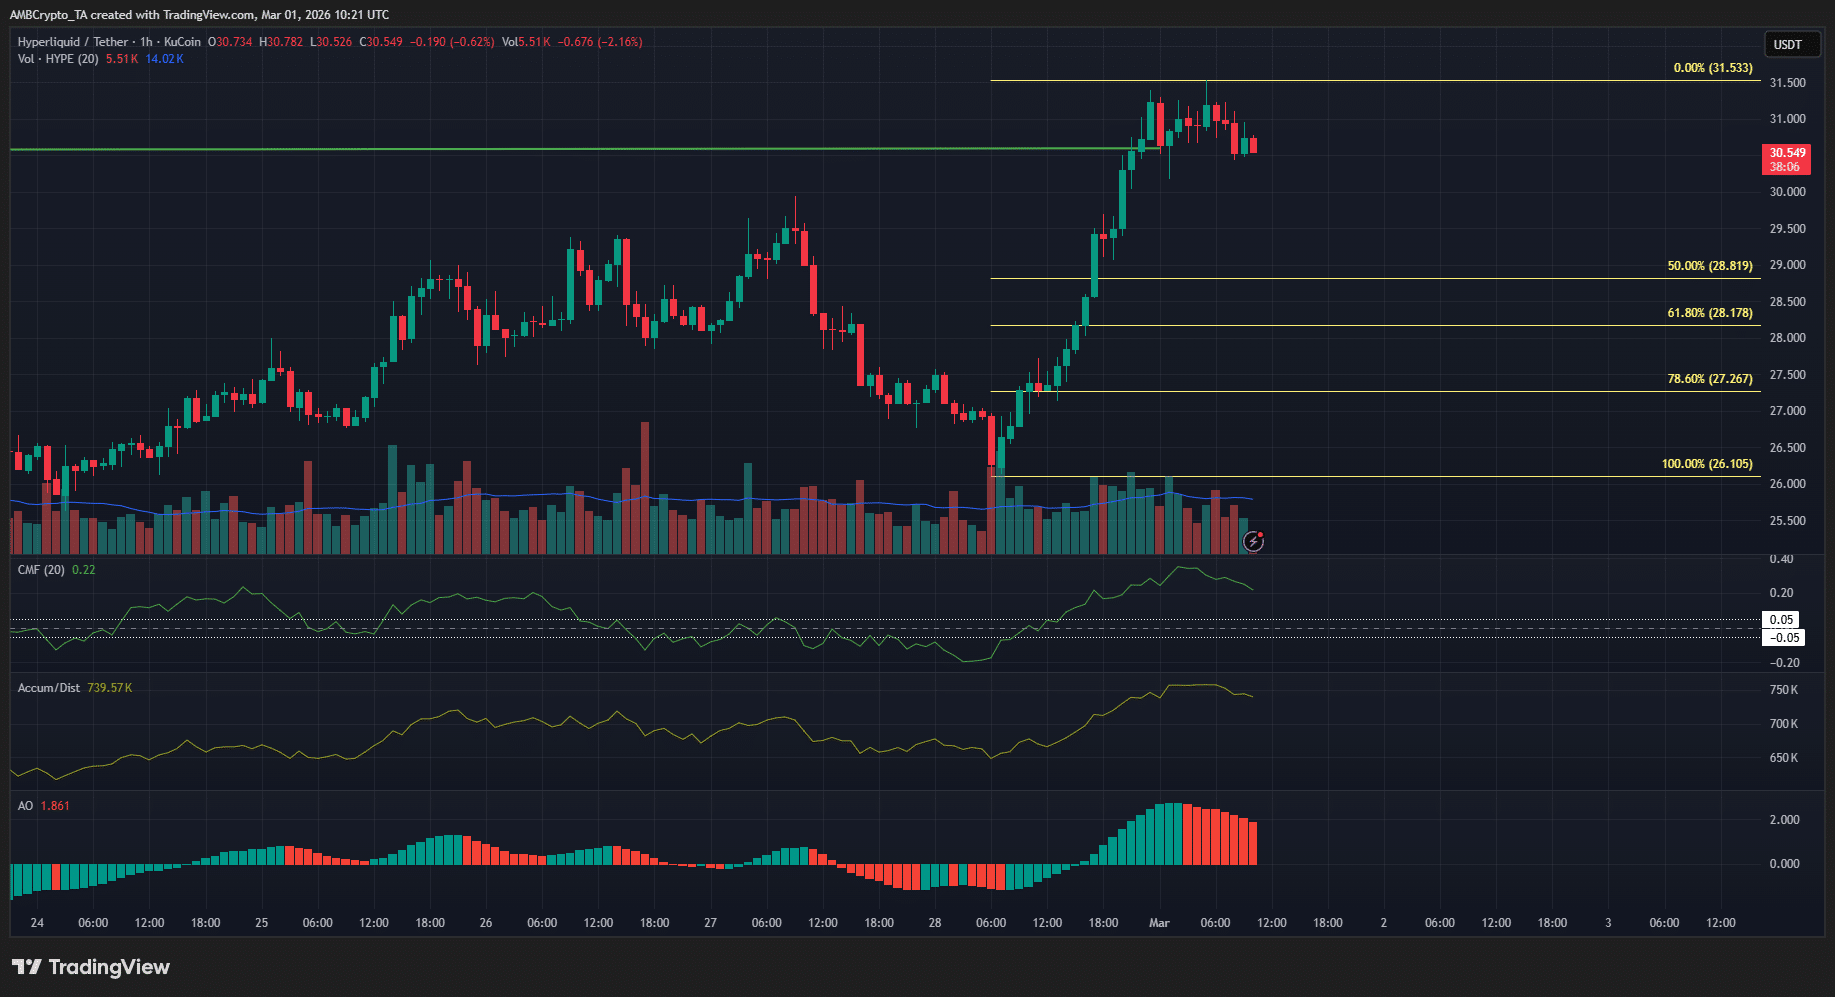
Source: HYPE/USDT on TradingView
Though maybe not immediately. The H1 swing structure was bullish, and the price was receding from the $31 local highs.
The golden pocket from $27.27 to $28.17 was mapped using the lower timeframe’s swing move.
A retest of this region would present an ideal buying opportunity. The next price targets were $38 and $42.
For the upcoming week, a retracement into the Fibonacci golden pocket and a bullish price reaction are expected for HYPE. On the other hand, a drop below $26.1 would invalidate the short-term bullish setup.
Final Summary
- Hyperliquid has a bullish market structure across the higher and lower timeframe price charts.
- A pullback below $28 over the next week could present a buying opportunity for traders.
Disclaimer: The information presented does not constitute financial, investment, trading, or other types of advice and is solely the writer’s opinion.
Go to Source to See Full Article
Author: Akashnath S