- HYPE is currently trading within a descending channel, with the potential to fall further depending on how it reacts at its current level.
- Key indicators and Total Value Locked (TVL) remain bearish. However, the RSI is gradually hinting that sell pressure may be easing.
Hyperliquid [HYPE] ranks among the top losers in the market, dipping 16.57%, over the past 24 hours. This decline has reduced its monthly gains to 64.93%.
The token’s movement at its current price level will determine whether it stages a significant rally or faces further losses as market sentiment weakens.
Will HYPE yield positively from this pattern?
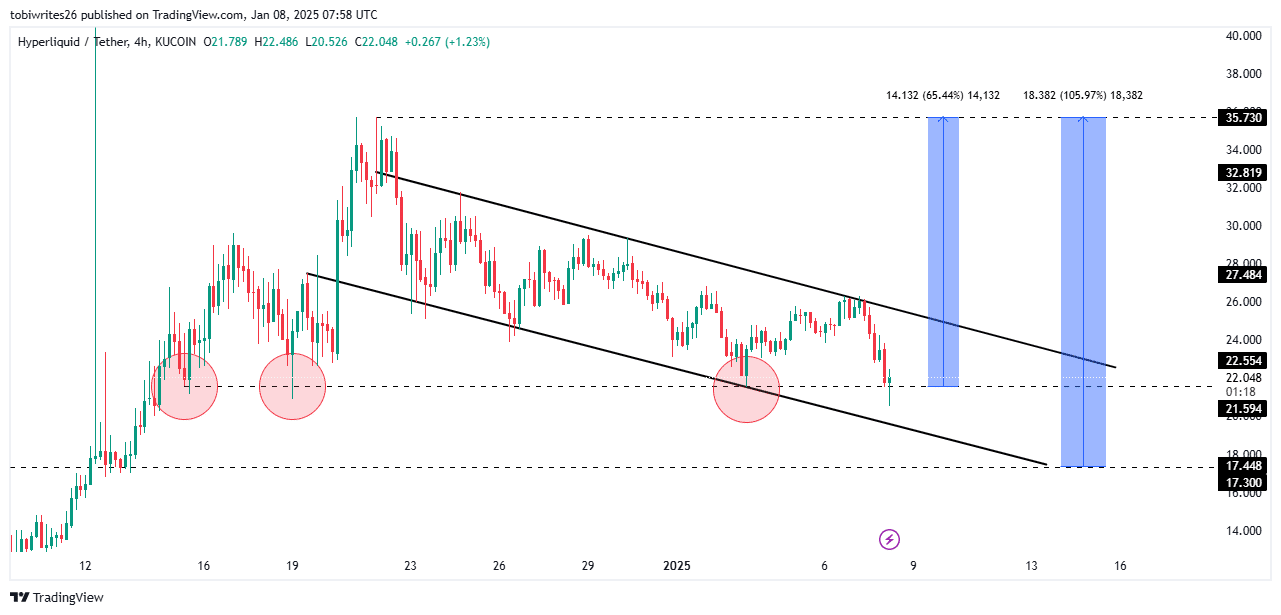
Technical analysis of HYPE’s 4-hour chart reveals that the asset is trading within a descending channel, characterized by lower highs and lower lows. Investors continue to accumulate in anticipation of an upward move.
A bullish breakout from this pattern occurs when the price breaches the upper resistance line of the channel, potentially reaching its peak of $35.7.
At the time of writing, HYPE is trading within a support zone at $21.59, which has previously acted as a bullish catalyst on three occasions. If this support provides the required momentum, HYPE could rebound and gain 65.44%, reaching the mentioned peak.
However, if the $21.59 support level is breached, HYPE could drop to the next support at $17.30. This level may act as a catalyst for a final push upward, potentially resulting in a 105.97% gain.
Mixed market signals
Currently, an analysis of technical indicators reveals mixed market sentiment, reflected in trader activity near the support level.
Go to Source to See Full Article
Author: Olayiwola Dolapo