
The Polygon (MATIC) attempts to break out from a long-term descending resistance trend line that has been in place for more than 770 days.
MATIC also trades under a short-term descending resistance trend line. Will it break out or get rejected?
Polygon Struggles With Long-Term Resistance
The weekly time frame outlook shows that MATIC has increased since June 2022. It created a higher low in October 2023 and accelerated its increase afterward.
Despite the upward movement, MATIC failed to break out from a long-term descending resistance trend line existing for 770 days. Rather, the price made four unsuccessful breakout attempts (red icons). It now trades below the trend line.
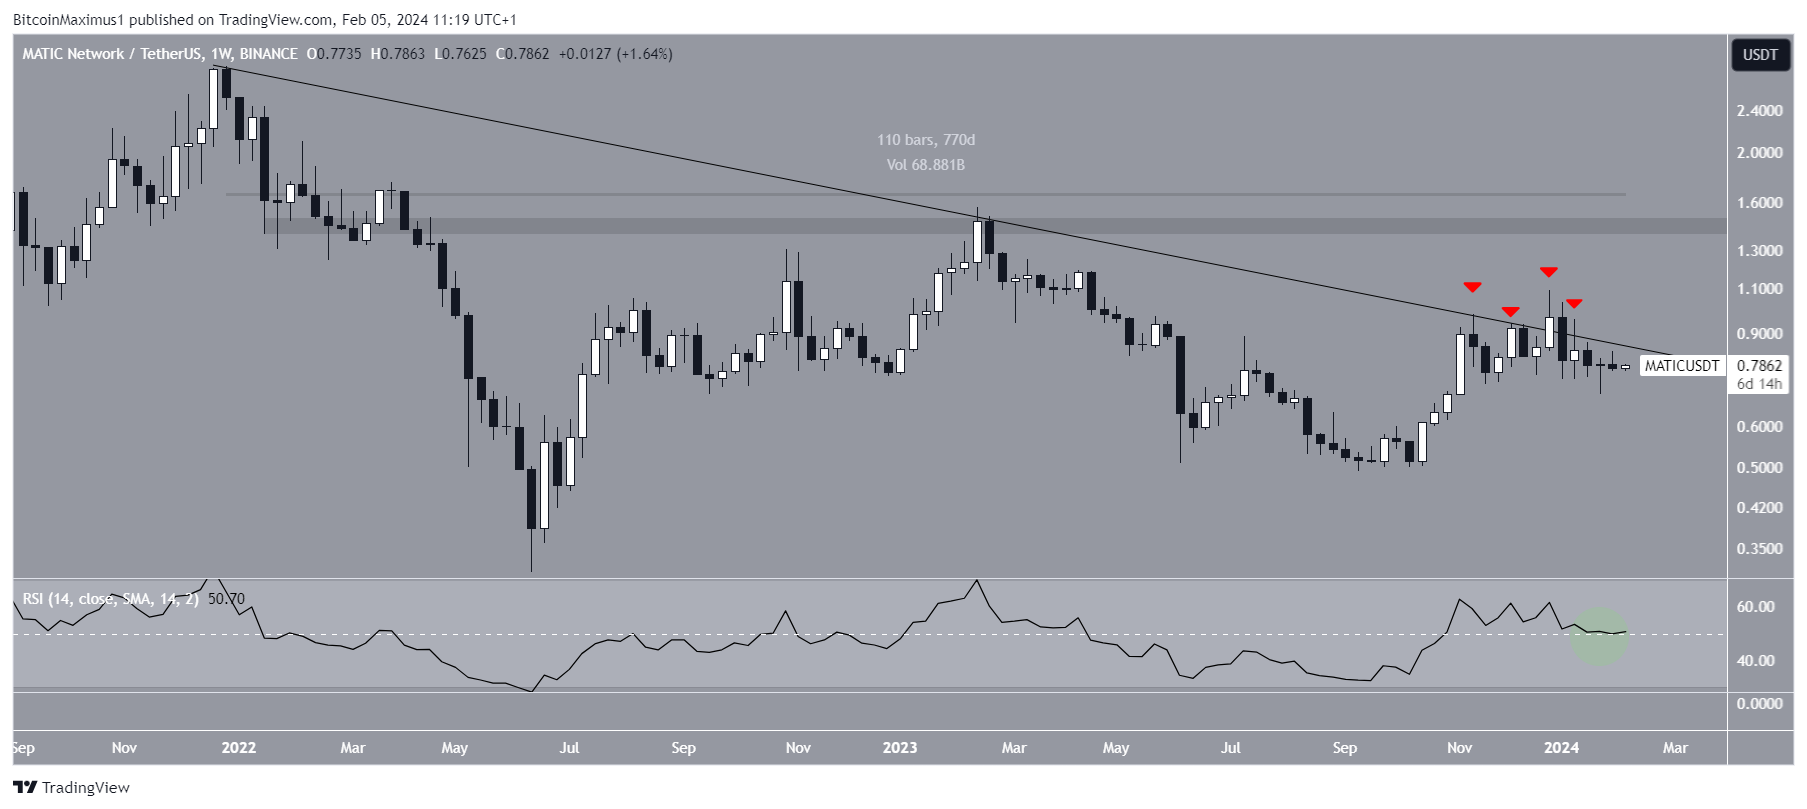
The weekly Relative Strength Index (RSI) gives a mixed reading. When evaluating market conditions, traders use the RSI as a momentum indicator to determine whether a market is overbought or oversold and whether to accumulate or sell an a
Go to Source to See Full Article
Author: Valdrin Tahiri
Tip BTC Newswire with Cryptocurrency
Donate Bitcoin to BTC Newswire

Donate Bitcoin Cash to BTC Newswire

Donate Ethereum to BTC Newswire

Donate Litecoin to BTC Newswire

Donate Monero to BTC Newswire

Donate ZCash to BTC Newswire


