- Resistance at $98,279-$100,080 remains key for Bitcoin’s push toward $100,000.
- More wallets have bought BTC around this price range.
Bitcoin’s [BTC] price trajectory continues to capture the attention of traders and investors alike, with critical support and resistance levels shaping its next move.
The path forward is becoming clearer, with significant accumulation zones and technical indicators revealing market sentiment.
Bitcoin shows strong demand zone
Analysis of the In/Out of the money data from IntoTheBlock highlights a critical demand zone. The data showed a demand zone between $94,800 and $97,700, with over 1.3 million addresses accumulating Bitcoin.
This cluster serves as a robust support level, with the current price of $97,860 hovering within this range.
Should Bitcoin fall below this zone, selling pressure could intensify, potentially leading to a bearish reversal. On the other hand, the resistance at $98,279 to $100,080 suggests that breaking above this level is essential for sustained bullish momentum.
Technical indicators signal stability amid volatility
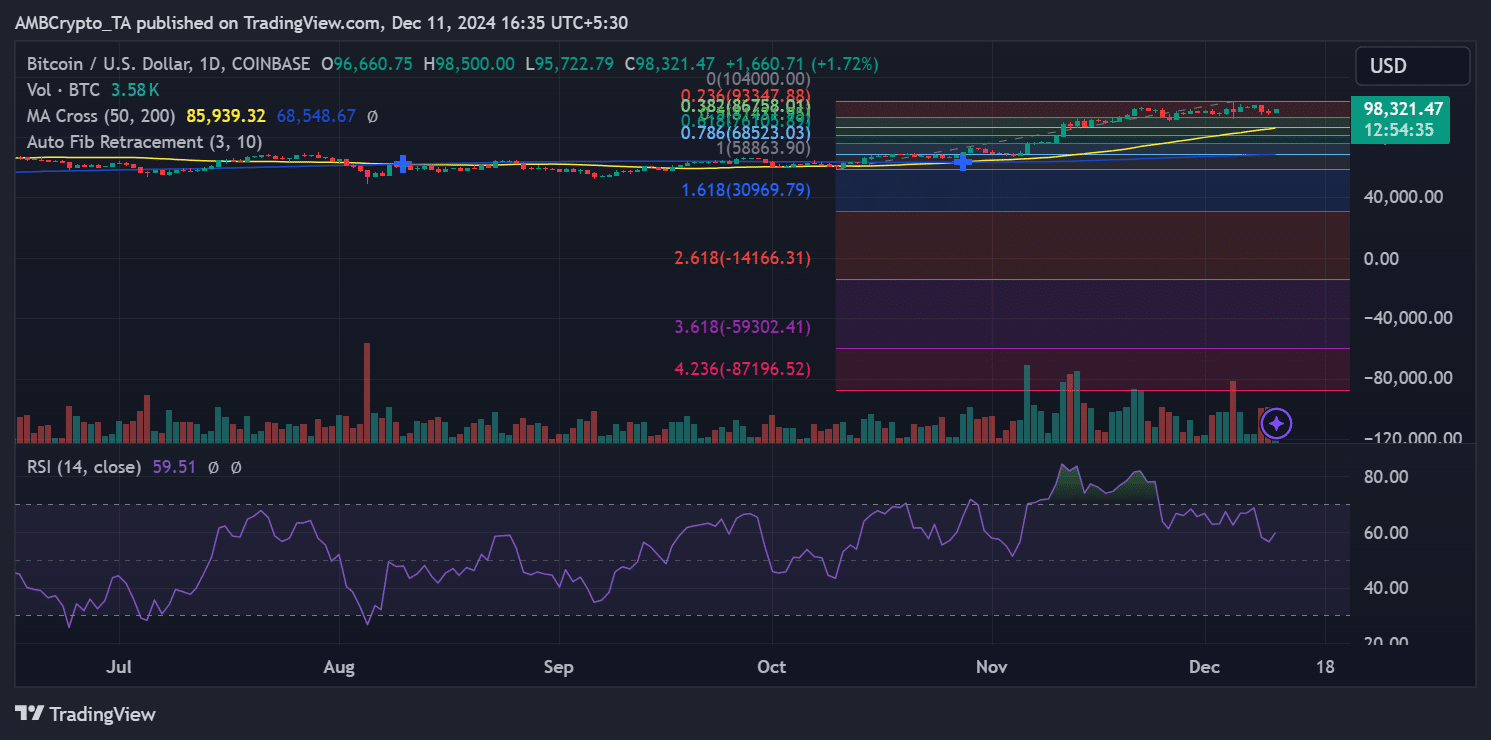
Bitcoin’s price currently trades at $98,313, reflecting a steady climb supported by the 50-day moving average at $85,939. Key retracement levels from Fibonacci indicators highlight $94,876 as a vital confluence area, aligning with the demand zone.
Source: TradingView
Furthermore, the RSI (14) stands at 59.51, indicating neutral momentum, while consistent volume levels suggest active market participation. Should Bitcoin maintain
Go to Source to See Full Article
Author: Adewale Olarinde