
The Aptos (APT) price broke out from a resistance pattern and could soon being a massive upward movement toward a new all-time high.
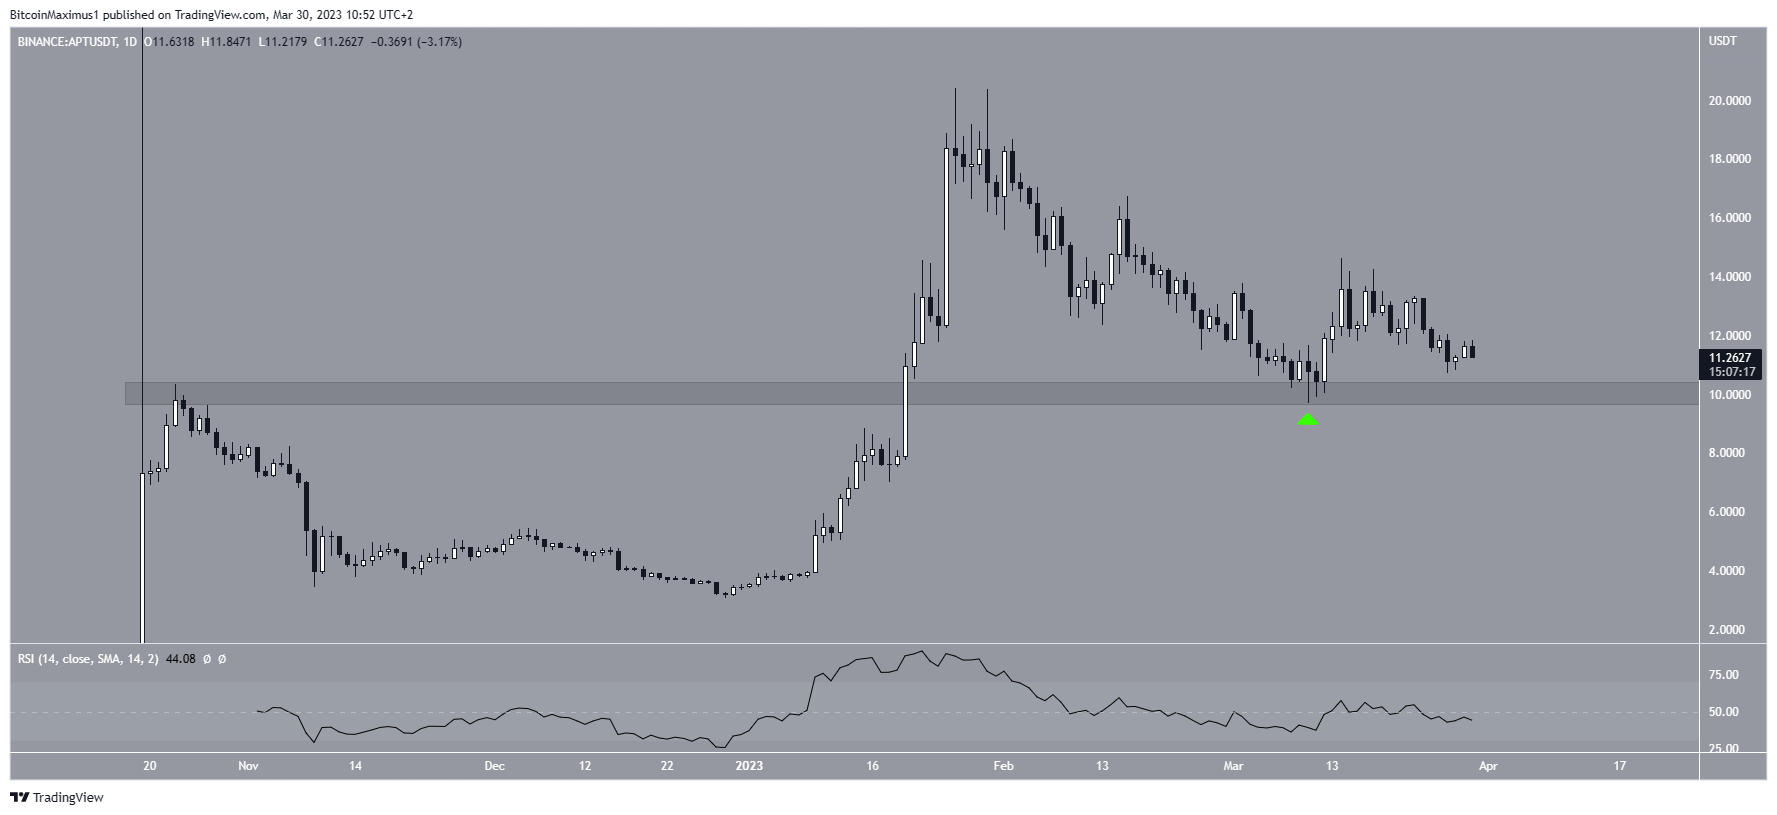
The APT price has fallen since reaching an all-time high of $20.40 on Jan. 26. The decrease led to a low of $9.70 on March 10 before the price bounced (green icon).
The bounce validated the $10 horizontal area, which previously had provided resistance.
However, despite the bounce, the daily RSI failed to move above 50 and has fallen below it again. Moreover, the price is very close to the $10 horizontal area once more.
As a result, neither the price action nor technical indicators provide decisive clues for the trend’s direction.
Aptos (APT) Price Wave Count Suggests Big Move Ahead
The wave count for APT provides a bullish outlook. After a massive upward movement in the beginning of the year, the APT price corrected under a descending resistance line. The correction ended right at the 0.618 Fib retracement support level at $9.72 on March 10.
The price has increased since and broke out from the descending resistance line two days later.
It is possible that this is the beginning of a new
Go to Source to See Full Article
Author: Valdrin Tahiri
Tip BTC Newswire with Cryptocurrency
Donate Bitcoin to BTC Newswire

Donate Bitcoin Cash to BTC Newswire

Donate Ethereum to BTC Newswire

Donate Litecoin to BTC Newswire

Donate Monero to BTC Newswire

Donate ZCash to BTC Newswire


