HBAR’s price has struggled to maintain a steady uptrend over the past month. After a 10.7% decline over 30 days, the token has managed a mild 1.24% gain in the past 24 hours.
While its 3-month chart still shows a 16.4% increase, the recent action signals growing reliance on shorter-term spikes rather than sustained rallies. Despite the broader weakness, one bullish pattern has emerged. The 4-hour RSI is starting to tell a different story — but whether it’s enough to hold the price up remains to be seen.
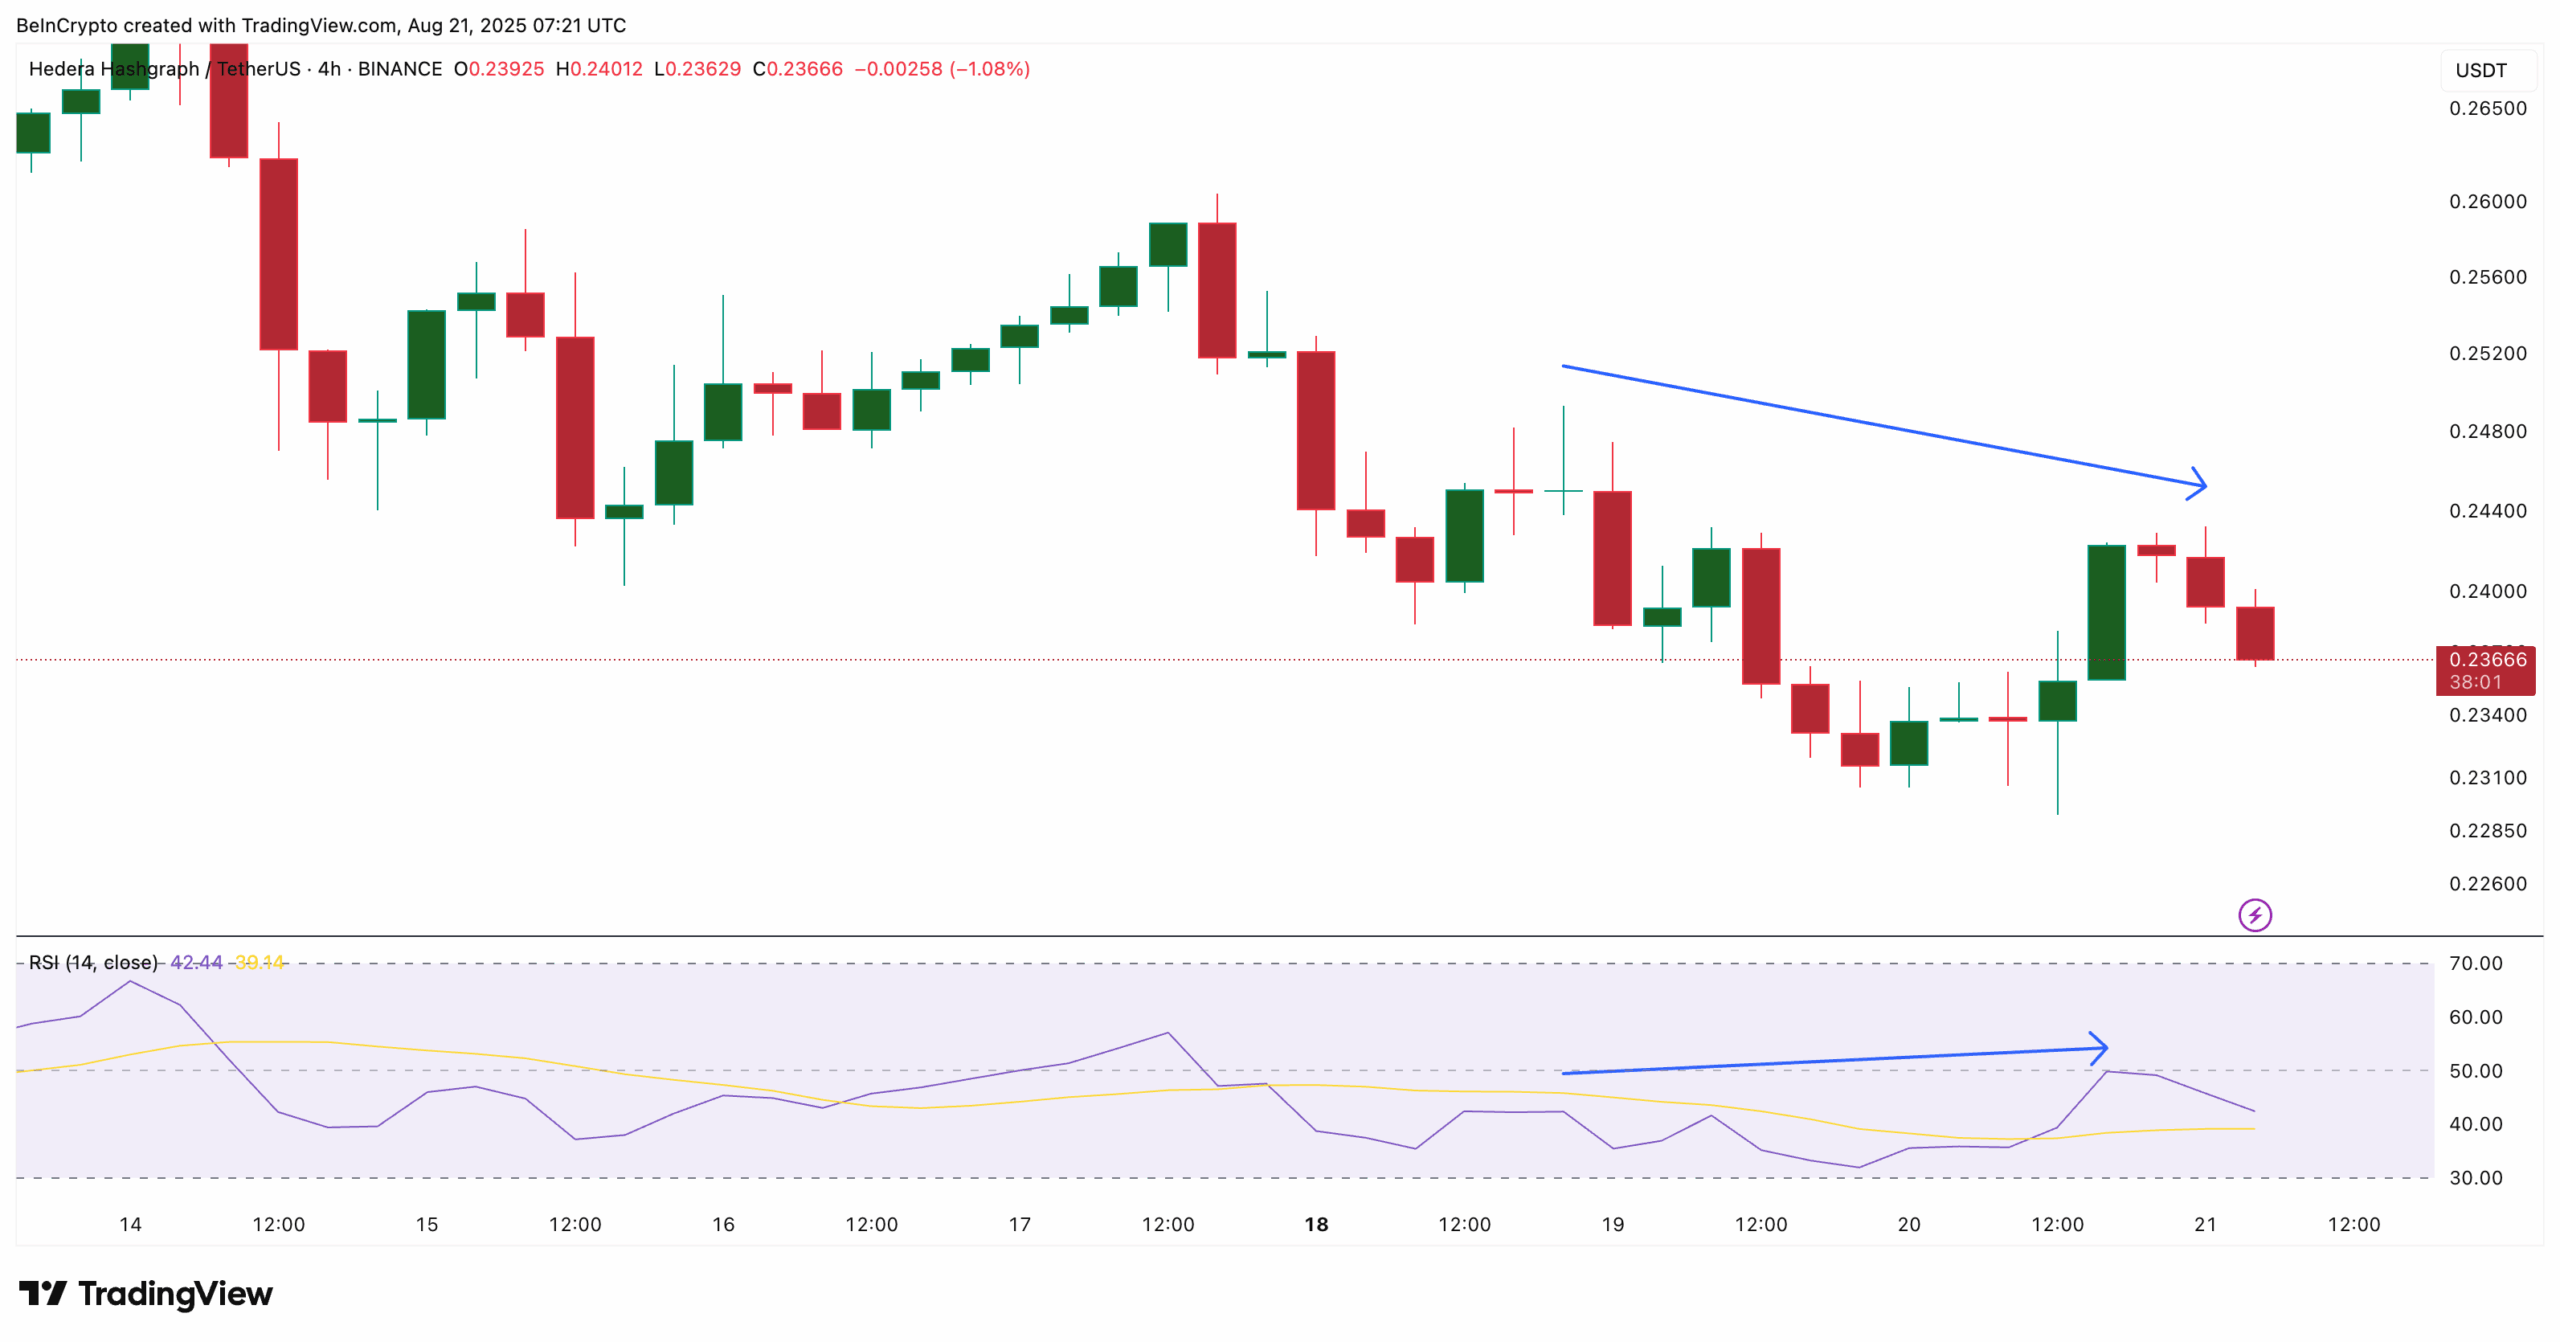
RSI Flashes Divergence But Buyers Retreat
The Relative Strength Index (RSI) is a momentum tool that shows whether buyers or sellers have more control. The Relative Strength Index (RSI) on HBAR’s 4-hour chart shows a subtle bullish divergence.
Between August 18 and August 20, the HBAR price formed a lower high, but the RSI climbed higher during the same period. This divergence usually hints that buying momentum is attempting to return — at least in the short term — even as the price struggles to break resistance.
Go to Source to See Full Article
Author: Ananda Banerjee
