Disclaimer: The information presented does not constitute financial, investment, trading, or other types of advice and is solely the writer’s opinion.
- HBAR has a bearish structure and showed downward momentum in the lower timeframe charts.
- The retest of the range lows likely provided a buying opportunity.
Hedera [HBAR] posted strong gains between 12 -14 September. Its rally measured 21.15% and took just over two days, but HBAR ran into a higher timeframe resistance zone at the $0.054 mark.
Read Hedera’s [HBAR] Price Prediction 2023-24
Hedera is also building toward becoming one of the top networks for stablecoin issuers, something that long-term investors would be keenly interested in. But in the short term, the prices have lacked a steady trend over the past two weeks.
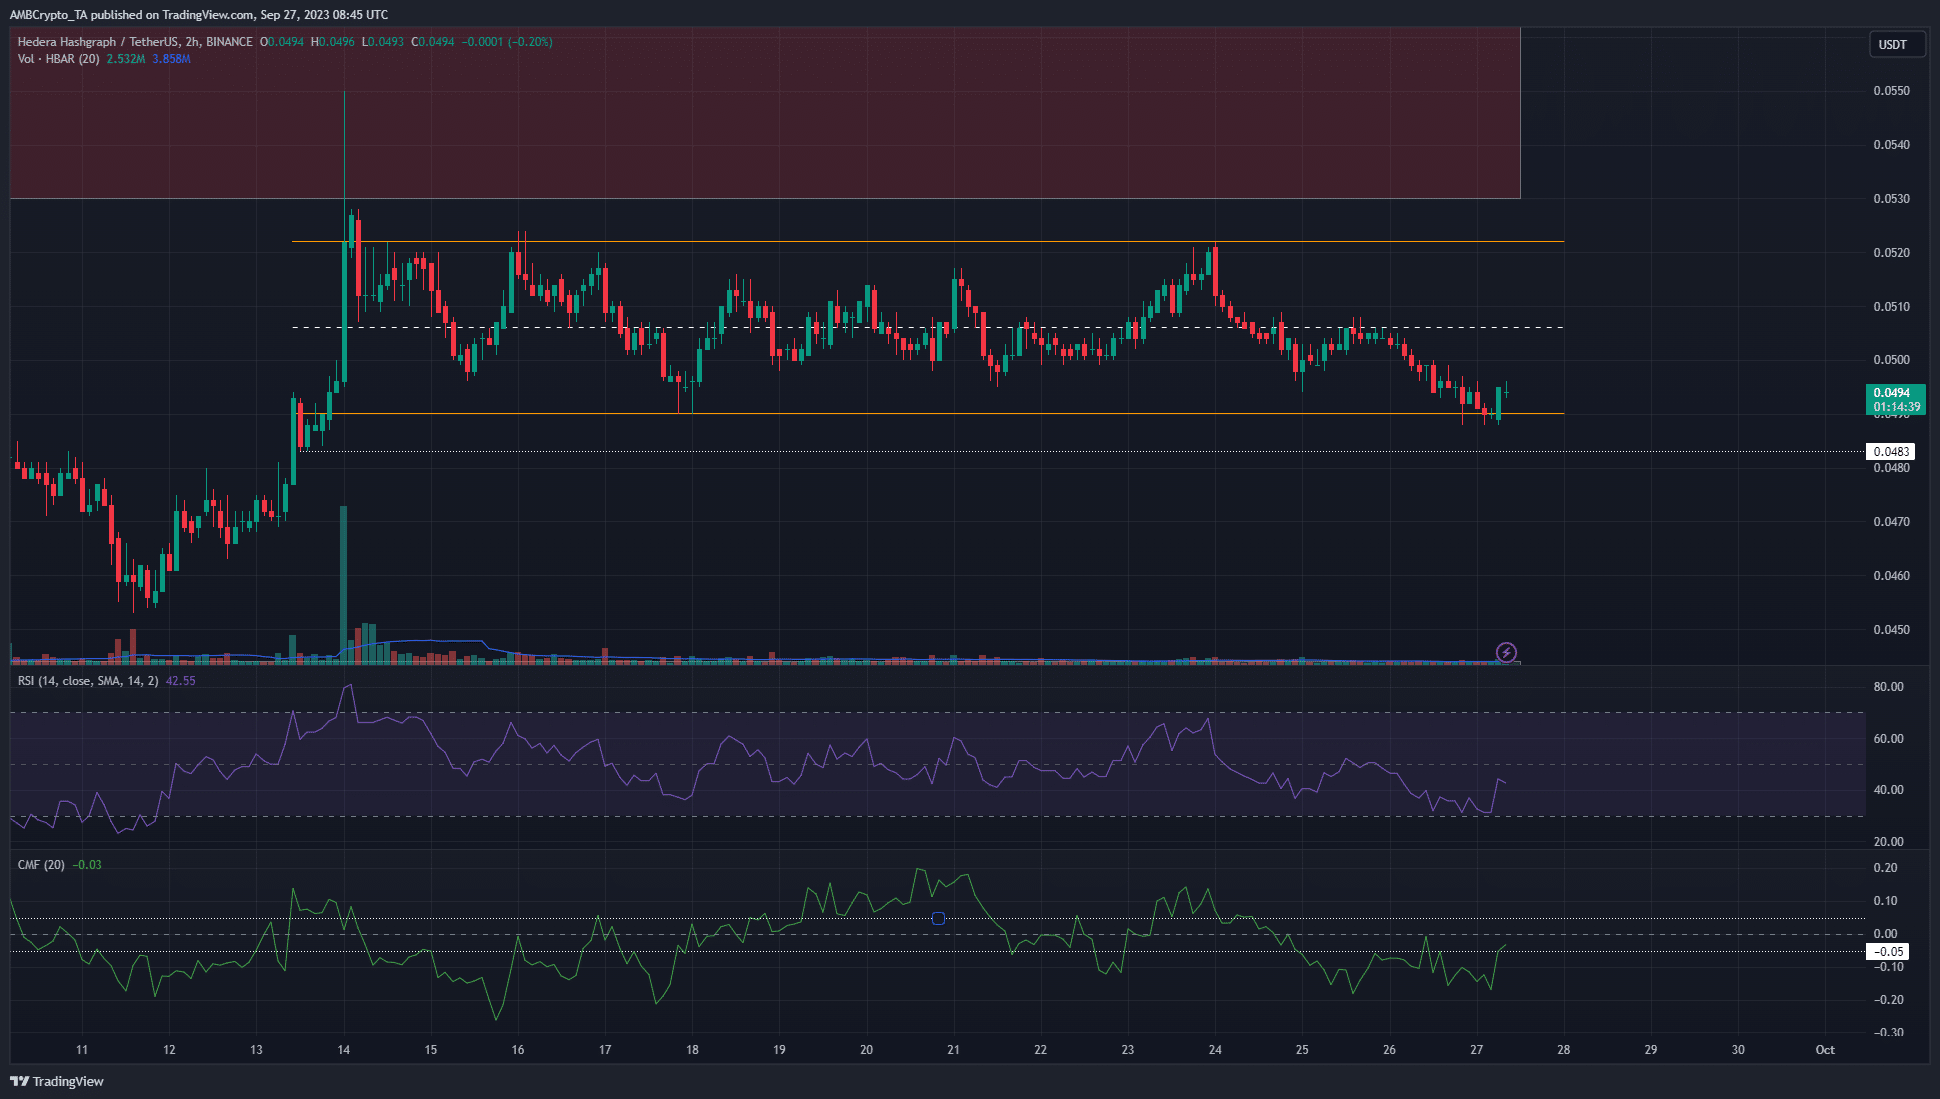
The range lows were under attack once more
The 2-hour chart showed that Hedera has traded within a range (orange) that extended from $0.049-$0.052. At the time of writing, HBAR saw a bounce from the range lows, but its momentum and market structure were bearish.
The mid-range resistance at $0.0506 was a target for lower timeframe traders looking to long this bounce.
The CMF showed that there was no significant capital inflow to the Hedera market in the past few days-quite the opposite. The indicator has been below -0.05 for the majority of the past 48 hours, signaling strong sell pressure.
The $0.054-$0.057 region (red box) to the north was a bearish order block on the 12-hour chart. It has been in play since 29 August, and the mid-September rally faced a firm rejection from this resistance zone.
The uptick in spot demand for HBAR could be a sign of things to come
Author: Akashnath S
Tip BTC Newswire with Cryptocurrency
Donate Bitcoin to BTC Newswire

Donate Bitcoin Cash to BTC Newswire

Donate Ethereum to BTC Newswire

Donate Litecoin to BTC Newswire

Donate Monero to BTC Newswire

Donate ZCash to BTC Newswire


