Disclaimer: The information presented does not constitute financial, investment, trading, or other types of advice and is solely the writer’s opinion.
- Polkadot was near the range lows but saw a bullish structure break.
- The rise in demand meant the range highs were the next target, provided Bitcoin does not encounter sharp losses.
Polkadot [DOT] saw some bullish pressure emerge in the past 24 hours. On Monday, 28 August, Polkadot was able to breach a short-term resistance level at $4.56. This signaled bullish intent. However, the sentiment remained bearish across the crypto market.
Realistic or not, here’s DOT’s market cap in BTC’s terms
Bitcoin [BTC] was hovering above the $26k level, but was indecisive about the trajectory of its next move. It was likely that another move toward $25k could occur – which would lead to losses for DOT. Should traders lean bearish or bullish on the altcoin?
Polkadot has begun to march higher, but it was unclear if the bulls can sustain it
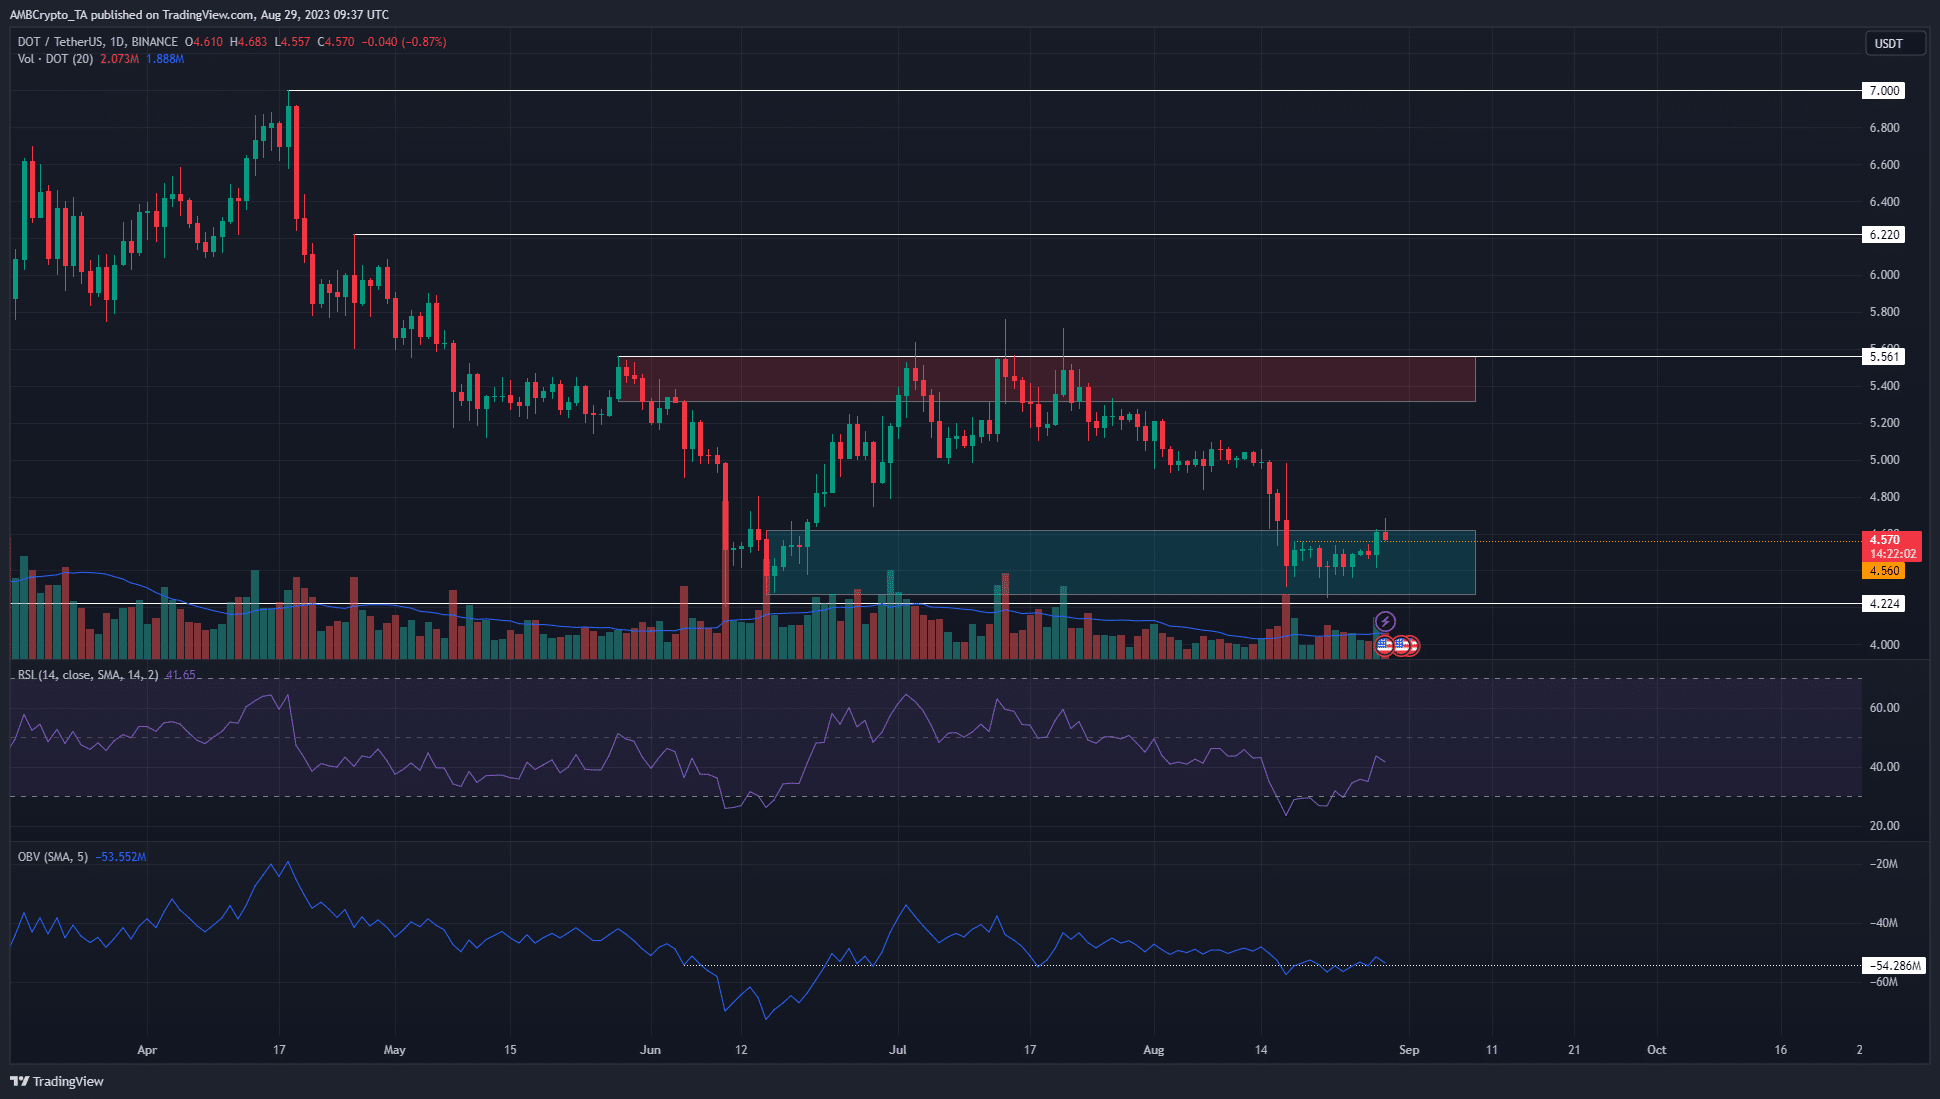
The 1-day chart showed that the $4.5 zone highlighted in cyan was a bullish order block. The $5.5 area marked in red represented a bearish order block, and together they showed that DOT could trade within this range in the coming weeks.
A look at the lower timeframe charts showed that there was a bullish market structure break on Monday when DOT climbed above the recent lower high at $4.56. Since it occurred within the higher timeframe order block, it appeared likely that bulls could drive prices higher.
Yet, the OBV did not see a strong move higher and continued to cling to a two-month-old support level. Meanwhile, the RSI remained below neutral 50 on the daily chart to show momentum favored the sellers.
The break i
Go to Source to See Full Article
Author: Akashnath S
Did you like this?
Tip BTC Newswire with Cryptocurrency
Donate Bitcoin to BTC Newswire
 Scan the QR code or copy the address below into your wallet to send some bitcoin:
Donate Bitcoin Cash to BTC Newswire
Scan the QR code or copy the address below into your wallet to send bitcoin:
Donate Ethereum to BTC Newswire
Scan the QR code or copy the address below into your wallet to send some Ether:
Donate Litecoin to BTC Newswire
Scan the QR code or copy the address below into your wallet to send some Litecoin:
Donate Monero to BTC Newswire
Scan the QR code or copy the address below into your wallet to send some Monero:
Donate ZCash to BTC Newswire
Scan the QR code or copy the address below into your wallet to send some ZCash:
Tip BTC Newswire with Cryptocurrency
Donate Bitcoin to BTC Newswire

Donate Bitcoin Cash to BTC Newswire

Donate Ethereum to BTC Newswire

Donate Litecoin to BTC Newswire

Donate Monero to BTC Newswire

Donate ZCash to BTC Newswire


