
Bitcoin [BTC] has faced severe stress in recent months. The final bear market capitulation might be a few months away, but macro market uncertainties were affecting Bitcoin demand.
Analysts believed that the $65k psychological support was pivotal. So long as BTC traded above this price, the price action would remain constructive.
There was some evidence that the recent rally had stretched the market, based on the Fibonacci-Adjusted Market Mean Price model chart.
This supported the idea that the recent rally was nothing more than a bull trap, accelerated by the short liquidations Bitcoin triggered on its way above $70k.
AMBCrypto reported that, in the short term, the $63.7k was the critical support level traders should watch.
Bitcoin’s rally is likely coming to an end
Source: CryptoQuant Insights
Crypto analyst Darkfost pointed out that the crypto market was struggling in a difficult environment for risk assets. BlackRock recently blocked investors from making withdrawals, adding to the FUD in the market.
The U.S. nonfarm payrolls data took analysts by surprise, showing a sharp drop when the labor market was expected to keep up its momentum and post gains.
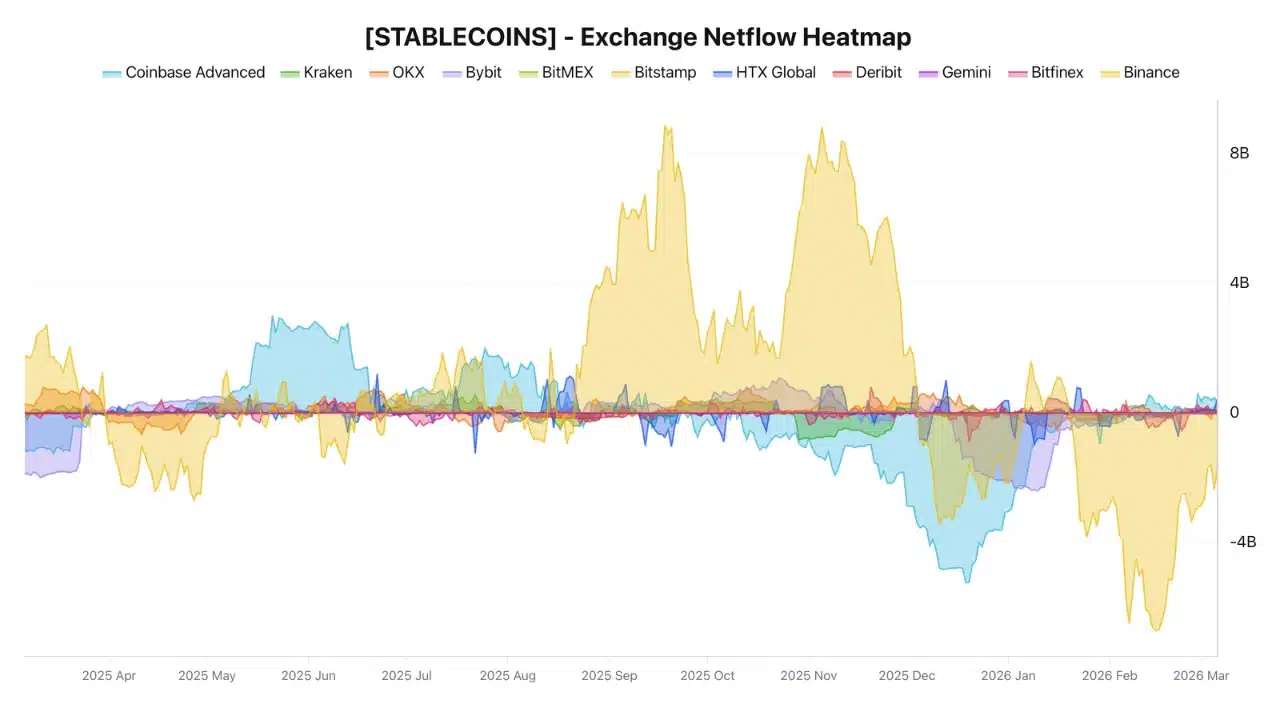
Uncertain conditions mean liquidity is leaving crypto as investors look to exit risk-on assets. Binance noted a $2 billion monthly stablecoin outflow.
This mammoth figure comes after monthly outflows reached $6.7 billion in February before stabilizing.
Source: CryptoQuant Insights
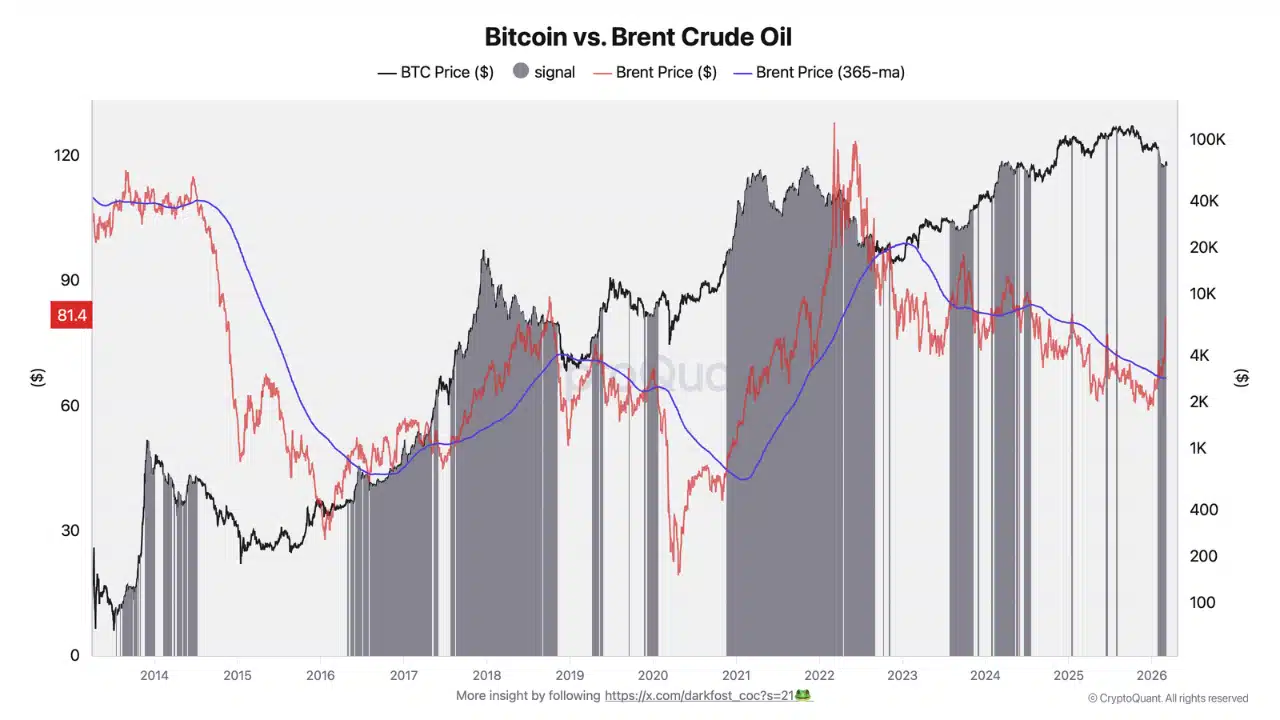
Geopolitical tensions disrupted the traffic flowing through the Strait of Hormuz, which accounts for nearly 25% of oil transported by sea.
This has caused oil prices to rise sharply, which affects inflation data and puts pressure on financial markets.
The analyst noted that such conditions were unfavorable for Bitcoin. They are not conducive to risk-taking investor sentiment and do not encourage capital flow into more speculative assets.
Gold was gaining in value against Bitcoin, deflating the argument that Bitcoin is a hedge against volatility. Taken together with other developments, it appeared that the previous week’s rally to $74k was not sustainable.
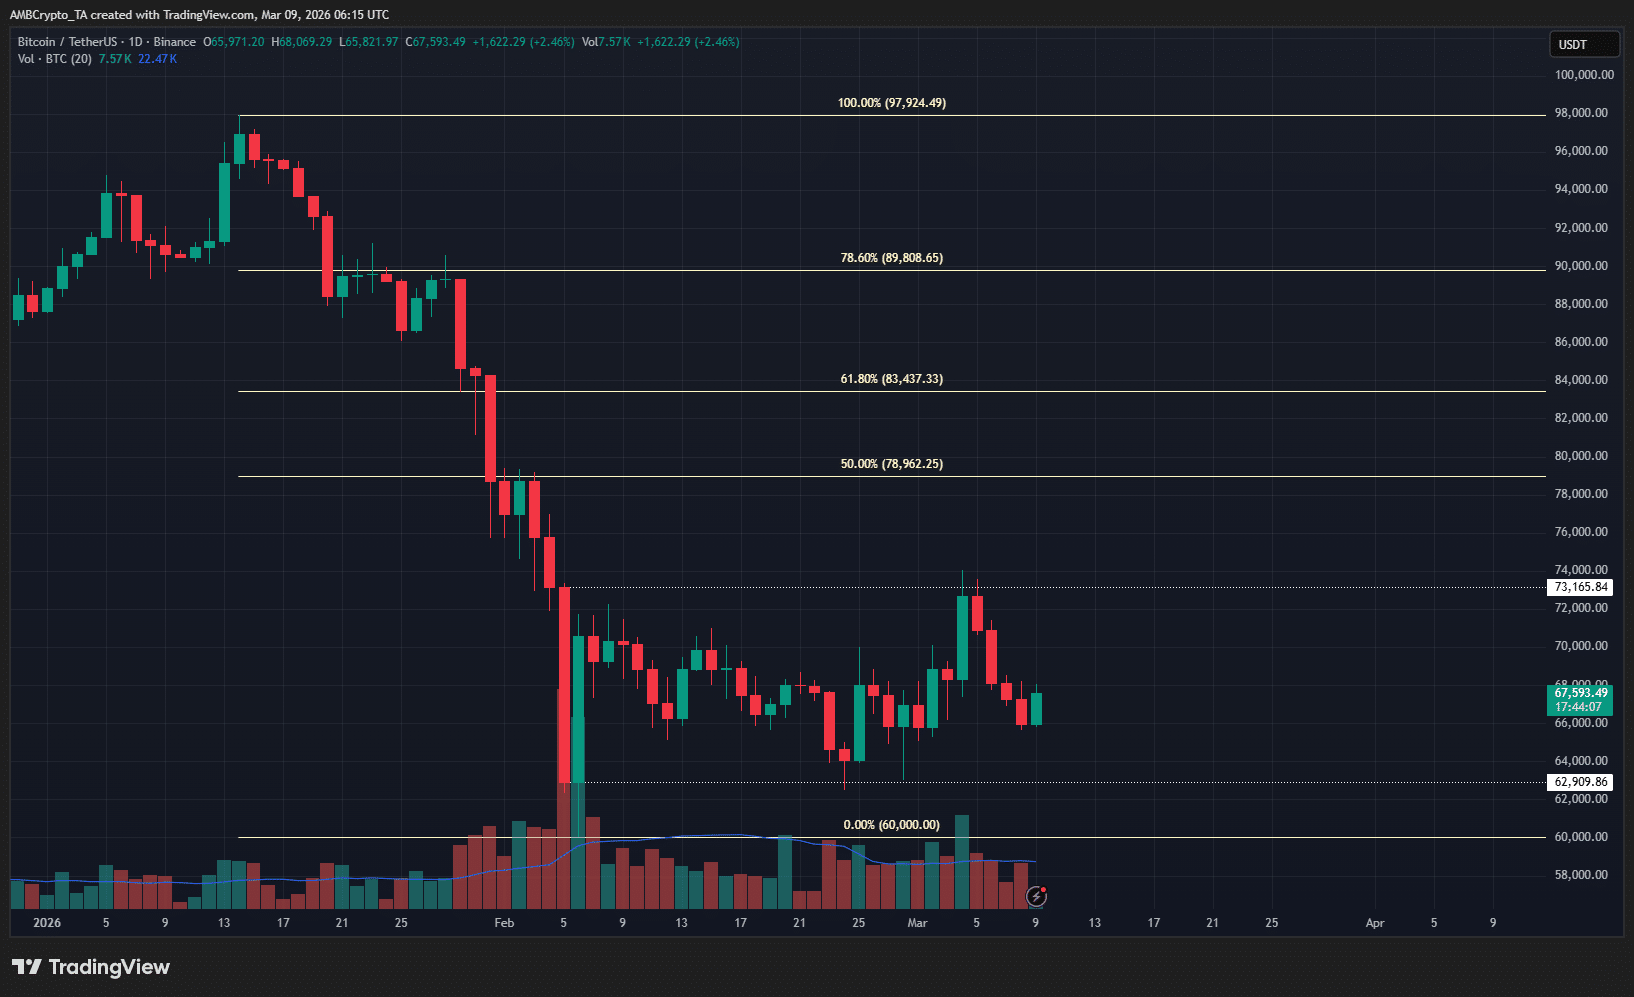
Source: BTC/USDT on TradingView
The swing structure was firmly bearish. Beating the $73.1k level from the early February crash would have been a bullish signal of intent, but it did not materialize.
As things stand, a move toward $62.9k appeared more likely than a BTC recovery from $66k.
Final Summary
- The rally to $74k came alongside a host of bearish macro market developments.
- The price chart showed a swift retracement from the $73k supply zone, and the price structure remained bearish.
Go to Source to See Full Article
Author: Akashnath S