
The recent 33% decline in Ripple’s (XRP) price has raised questions about whether this downward trend will continue or if a correction is nearing its end.
Currently, Ripple is finding significant support, which could play a crucial role in determining its next price movement. If this support level holds, it may provide a foundation for stabilization or a potential rebound.
However, if this support is breached, Ripple’s price could decline further, potentially falling to a lower level.
Ripple’s Price Trending Downward in Correction Since November
In November, XRP experienced a bearish rejection at the golden ratio resistance level, approximately at $0.75. This led to a corrective movement since then.
This month, XRP found support at the 50-month Exponential Moving Average (EMA), around $0.518, where it initially seemed to be rebounding in a bullish manner. However, the Moving Average Convergence Divergence (MACD) histogram has begun to trend downwards in a bearish direction this month, indicating a shift in momentum.
Despite the bearish trend in the MACD histogram, the MACD lines are still in a bullish crossover, and the Relative Strength Index (RSI) remains neutral, not indicating a clear directional trend.
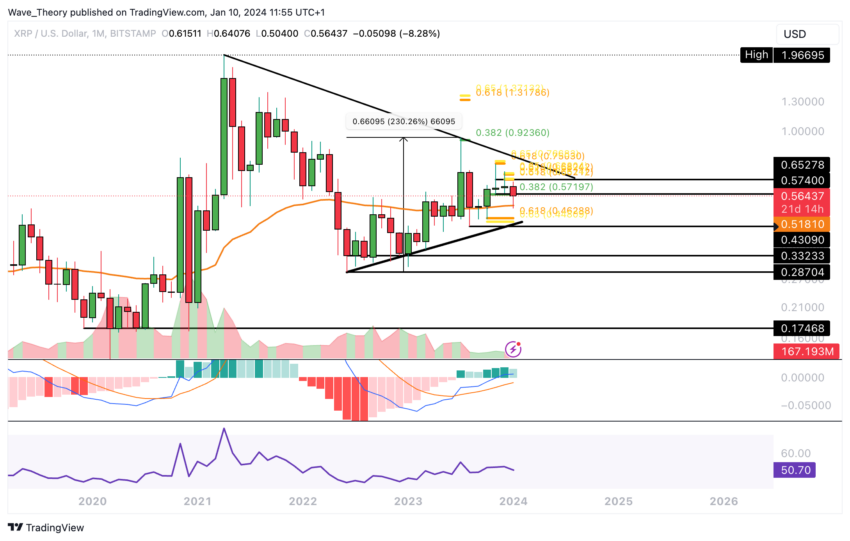
The combination of these factors in the monthly chart – the initial bullish rebound from the 50-month EMA, the bearish turn in the MACD histogram, along with the bullish MACD lines and a neutral RSI – results in a somewhat bearish overall outlook for Ripple in the near term.
This indicates a period of mixed signals and potential volatility for XRP’s price.
Is Ripple’s Price Headed for a Correction to $0.45 Golden Ratio Support?
Ripple’s (XRP) price is at the 50-week Exponential Moving Average (EMA) of around $0.547. Should this s
Go to Source to See Full Article
Author: Ryan James
Tip BTC Newswire with Cryptocurrency
Donate Bitcoin to BTC Newswire

Donate Bitcoin Cash to BTC Newswire

Donate Ethereum to BTC Newswire

Donate Litecoin to BTC Newswire

Donate Monero to BTC Newswire

Donate ZCash to BTC Newswire


