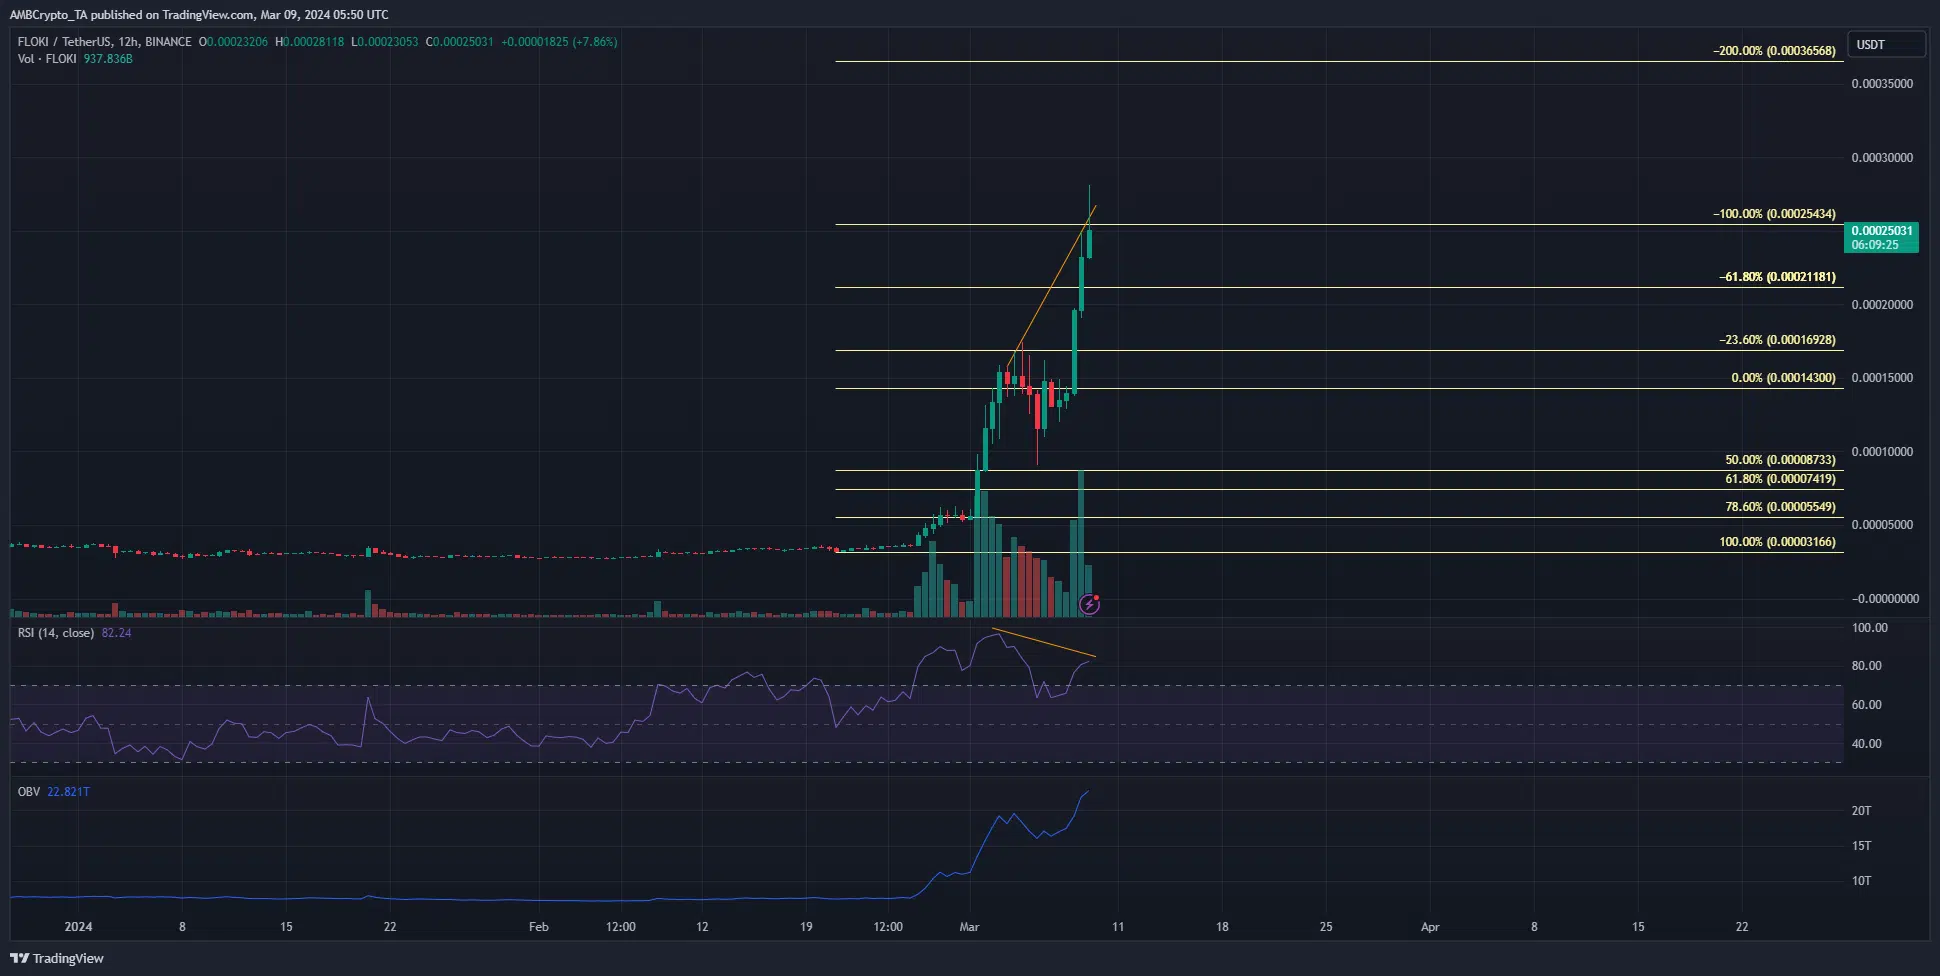
- FLOKI’s RSI made lower highs in the past 12 periods.
- The rising spot demand was encouraging for the bulls.
FLOKI [FLOKI] saw a brief pullback when Bitcoin [BTC] slumped from $69k to $59.5k on the 5th of March. It gained 103.65% from the low to the high within the past 36 hours, but there were signs of exhaustion.
The incredible strength behind meme coins means that despite over-extended conditions, FLOKI could continue its rally. Traders must thus exercise caution and wait for opportunities.
The momentum appears to have slowed down
The 12-hour chart of FLOKI saw the RSI moving well above the 70 mark, which indicated overbought conditions.
It was a sign that bullish momentum was inexorable, but at the same time, a divergence was spotted.
The price has made a higher high, while the RSI made a lower high. This bearish divergence between price and momentum suggested that we could see FLOKI prices pull back.
An examination of the 4-hour price chart showed that the $0.000146-$0.000166 was a key demand zone. However, a retest of this zone would see FLOKI shed 35%.
Given the high buying pressure behind the token, seen from the OBV making strong higher highs, such a deep pullback might not arrive.
Traders need to be prepared for a consolidation phase near the $0.000238-$0.00025 area before a bullish breakout past $0.00026 arrives.
On the other hand, a drop below $0.0002 would suggest that the short-term bias is bearish. In that scenario, traders could wait for the lower timeframe structure to break bullishly before buying.
The sentiment has not shifted toward the bears yet
Author: Akashnath S
Tip BTC Newswire with Cryptocurrency
Donate Bitcoin to BTC Newswire

Donate Bitcoin Cash to BTC Newswire

Donate Ethereum to BTC Newswire

Donate Litecoin to BTC Newswire

Donate Monero to BTC Newswire

Donate ZCash to BTC Newswire


