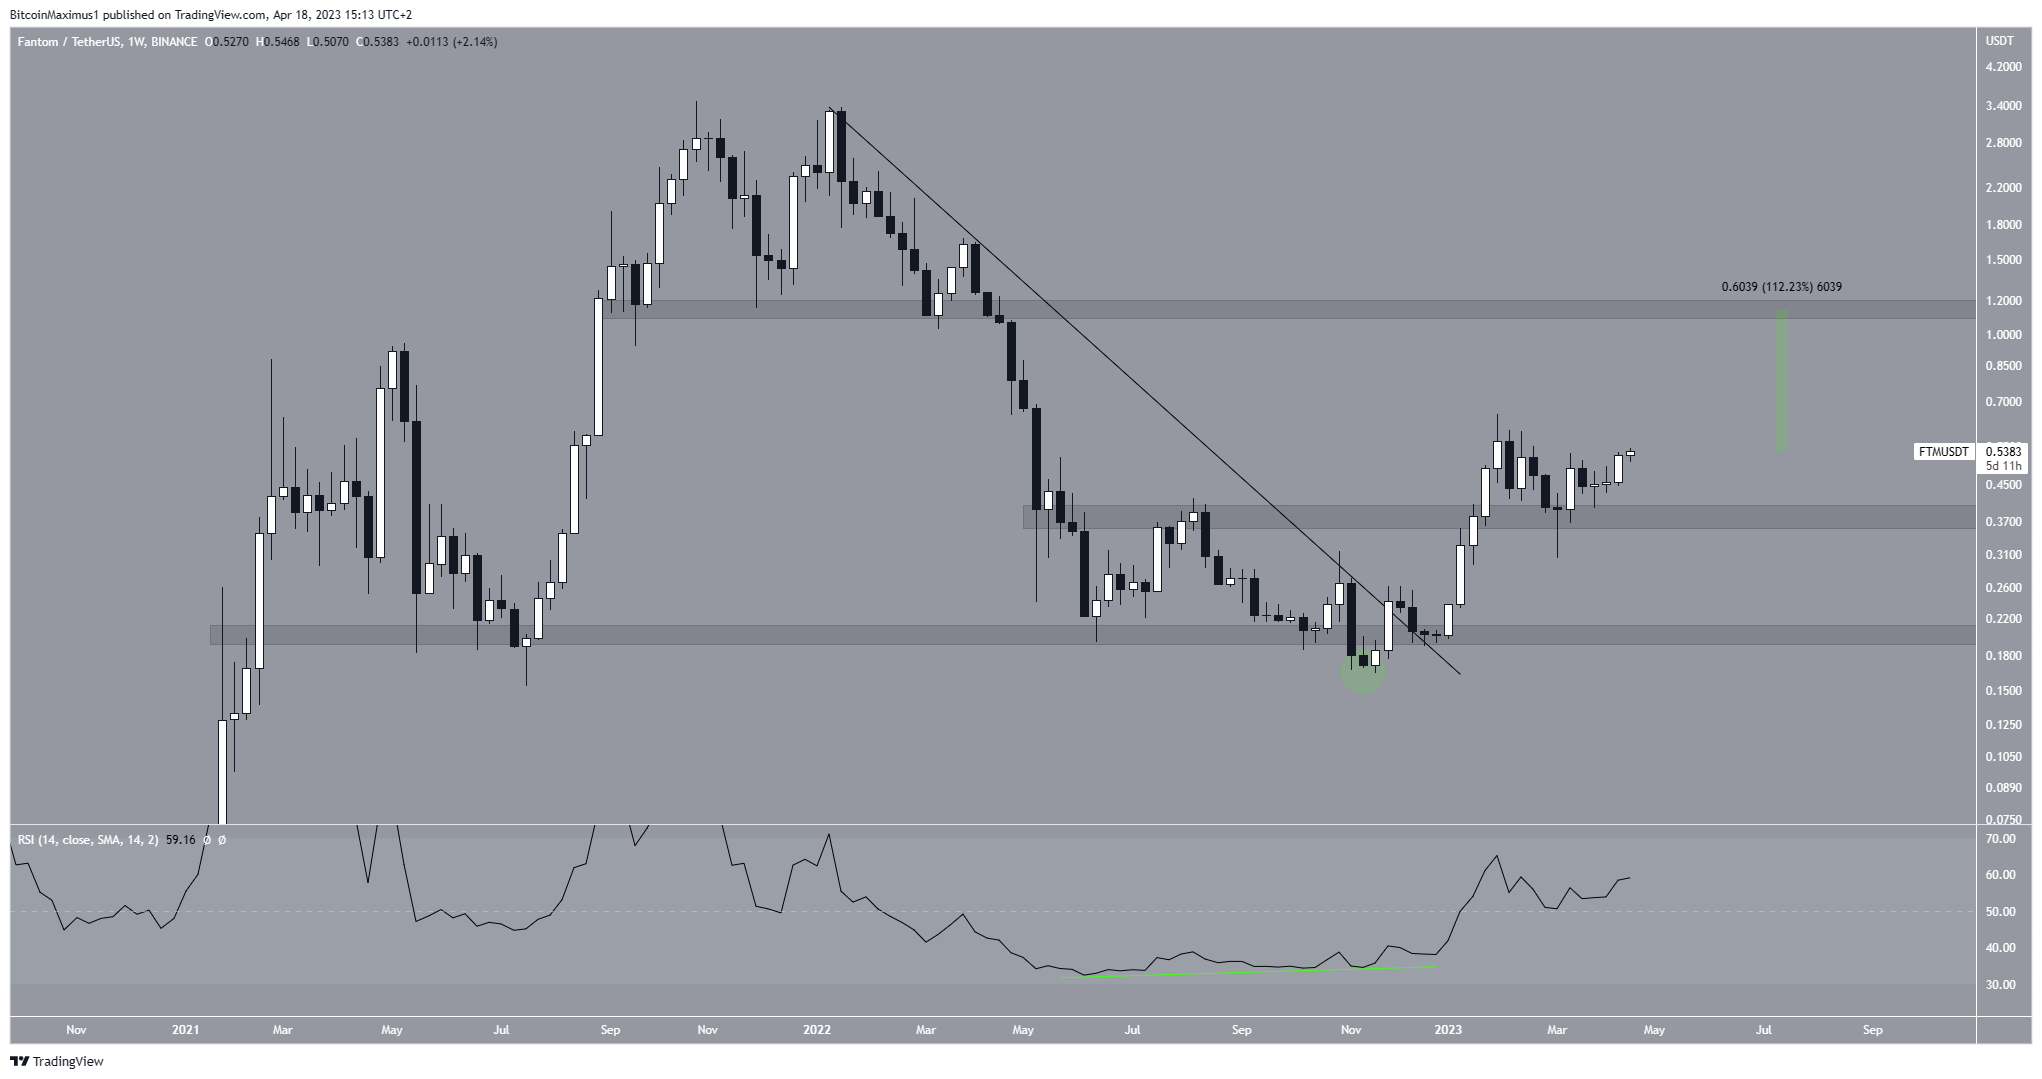
The Fantom (FTM) price has cleared a crucial horizontal resistance area. The next important resistance is 110% away from the current price. So where to next for FTM?
The FTM price is nearing its yearly highs and shows bullish signs in multiple time frames. It is possible that the rate of increase will accelerate soon or could it decrease in price?
Fantom Price Clears Long-Term Resistance
In January 2022, the FTM price hit an all-time high before decreasing below a descending resistance line. This caused a breakdown from the support level of $0.20 and led to a low of $0.16 in November 2022. However, this decline was just a temporary deviation, as the price of Fantom has since risen.
Upward movements usually follow breakdowns and deviations such as these. This is because the sellers could not push the price down. Rather, the $0.20 support area was reclaimed, and an upward movement followed.
The Relative Strength Index (RSI) showed a bullish divergence (green line) before the increase and now sits above 50, indicating a bullish trend. The RSI is a momentum indicator used to determine overbought or oversold conditions. An upward trend and a reading above 50 suggest that bulls still have momentum.

The FTM
Go to Source to See Full Article
Author: Valdrin Tahiri


