- Ethereum (ETH) seemed to be forming a bullish W-pattern on the weekly chart
- Altcoin’s Market Value to Realized Value (MVRV) ratio highlighted its fair valuation
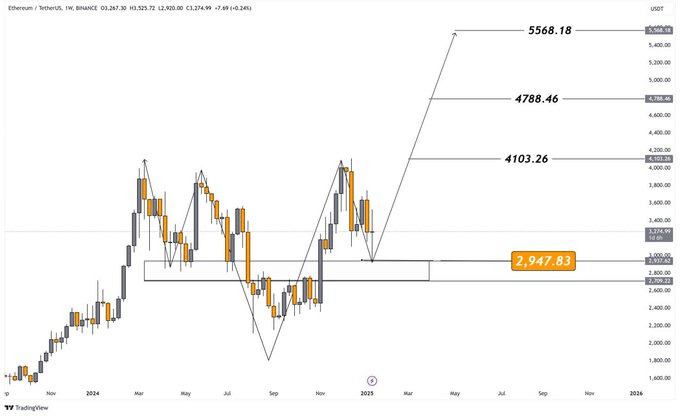
Ethereum (ETH), at the time of writing, was forming a bullish W-pattern on the weekly chart, signaling a potential trend reversal and significant upside. In fact, the altcoin seemed to be holding above the critical $2,947 support – A level that is now serving as the neckline of this formation.
This support zone is pivotal in determining Ethereum’s trajectory, with price targets set at $4,103, $4,788, and $5,568, as highlighted on the chart. A breakout above the neckline resistance would confirm the bullish trend, opening the door for significant gains.
This W-pattern can be interpreted to underline Ethereum’s resilience, highlighting a shift from bearish to bullish momentum. In fact, the altcoin’s price chart revealed that maintaining support above $2,947 would be crucial for this pattern to play out.
A confirmed breakout above $3,200 could pave the way for rapid upward movement towards the $4,100 resistance.
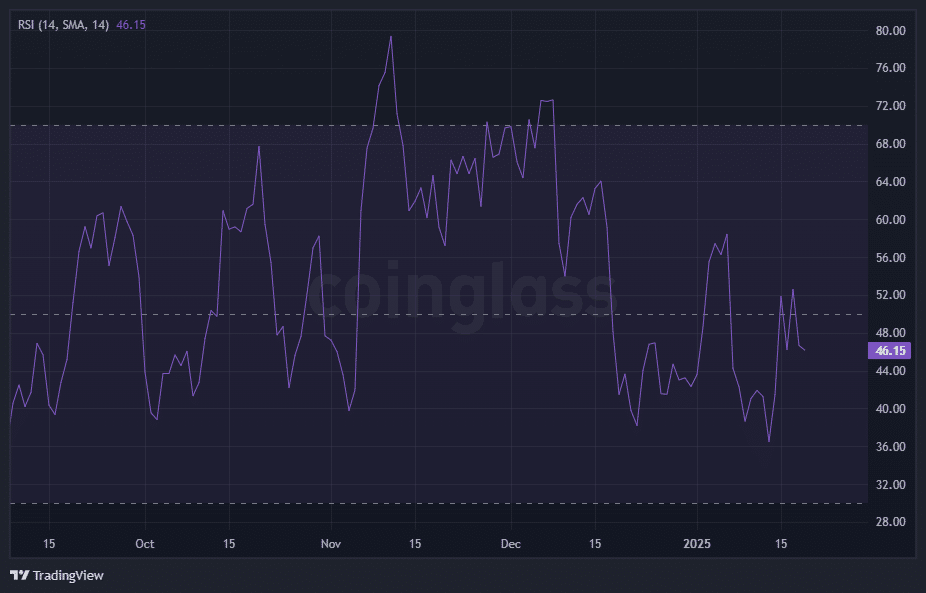
Gauging Ethereum’s momentum
From the perspective of momentum, the Relative Strength Index (RSI) had a reading of 46.15 at press time. This neutral level hinted at a balance between buyers and sellers in the altcoin’s market.
Go to Source to See Full Article
Author: Clinton Otieno