Disclaimer: The information presented does not constitute financial, investment, trading, or other types of advice and is solely the writer’s opinion.
- The market structure was bearish, but the lack of volatility persisted.
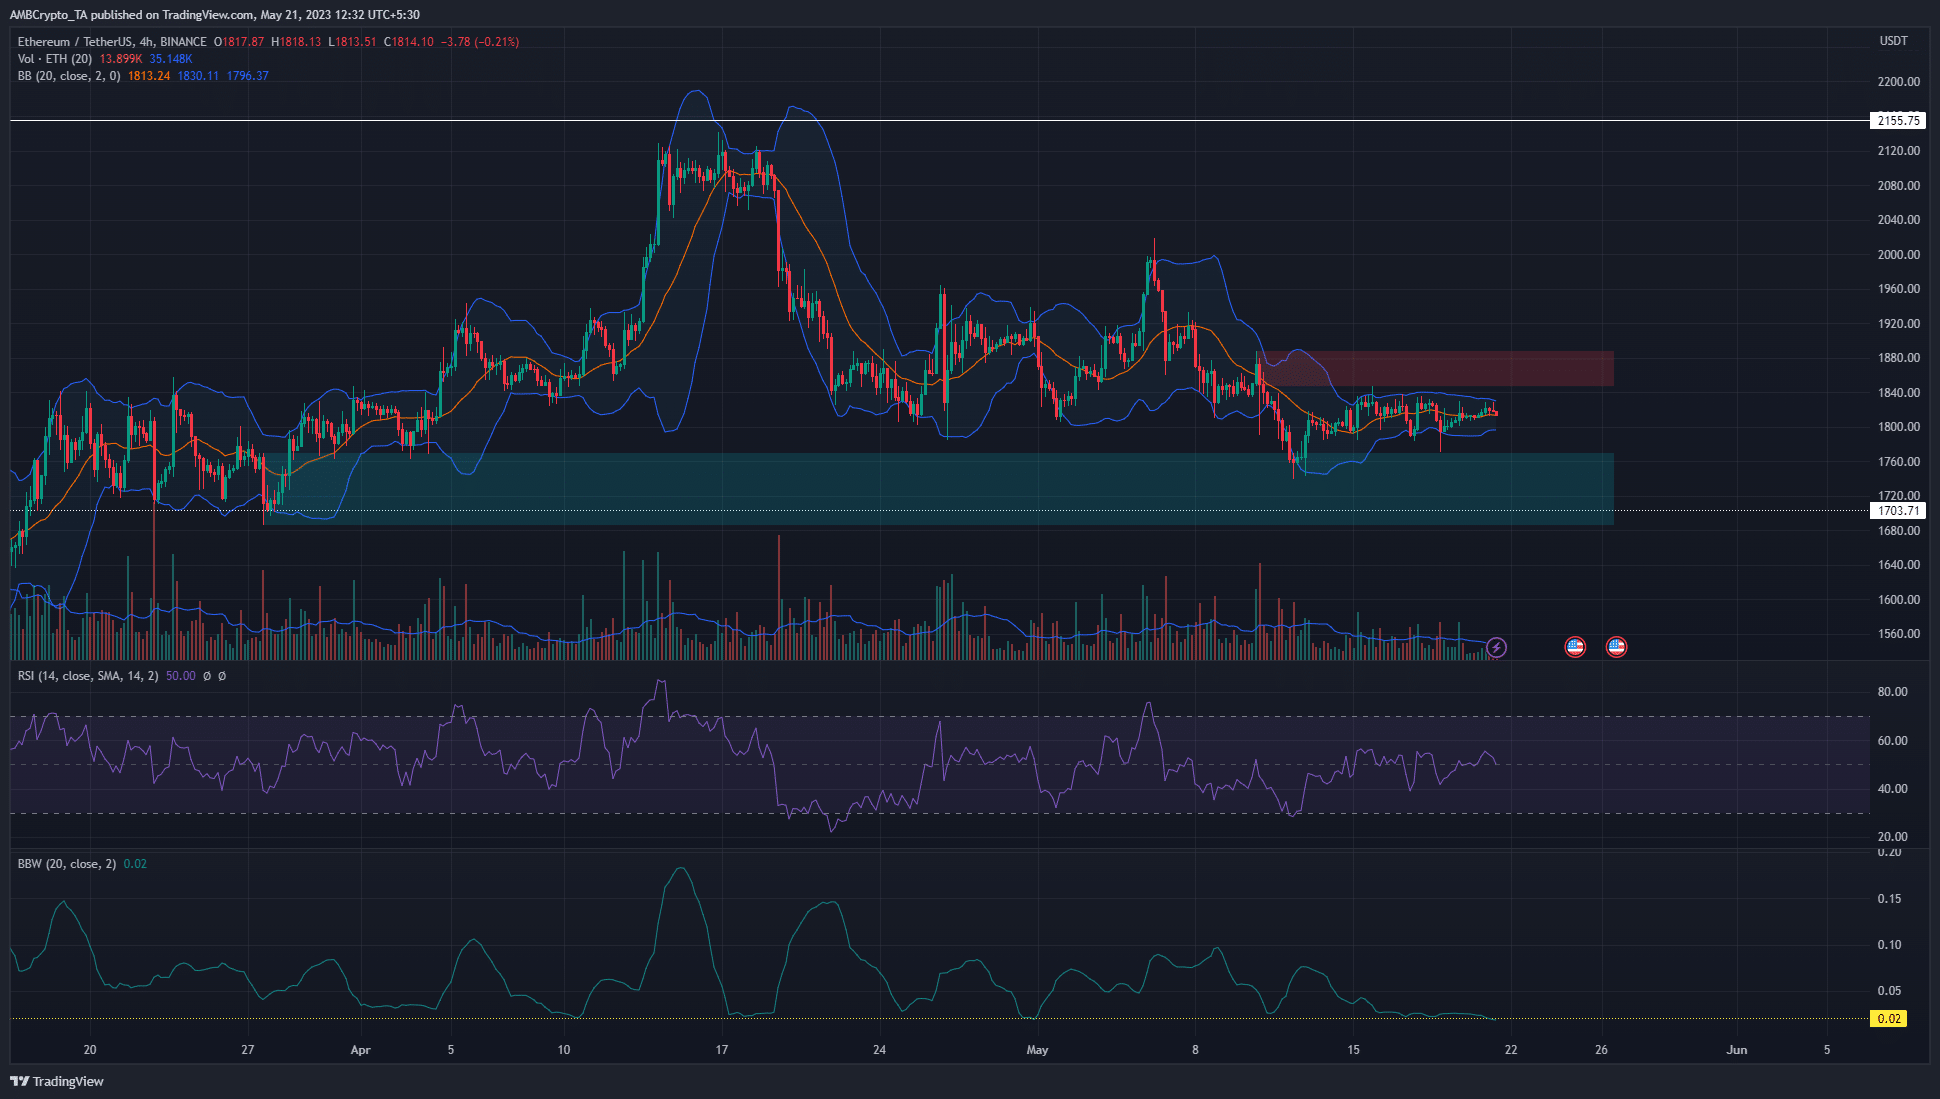
- Ethereum’s recent price action was bounded by resistance at $1880 and support at $1750.
In the past month, Ethereum [ETH] has shed close to 15.2% in value, measured from the swing high at $2141 to the press time market price of $1816. This was extremely disappointing to some ETH bulls, who expected a strong rally following the breach of the $2000 mark in April.
Read Ethereum’s [ETH] Price Prediction 2023-24
The declining volume and compression on the price charts pointed to an uneventful weekend. Will this be followed by a breakout north or south next week? Or, trading gods forbid, will Ethereum prices continue to stutter just above the $1800 mark?
Tight Bollinger Bands meant traders can wait for a sharp move to decide the direction
The Bollinger Bands were closely bound to the price and the BB width indicator was at two-month lows once more. Trading volume was declining over the past few days as well. This came after ETH tested the 4-hour bullish order block at the $1720 area (cyan). The RSI was also unable to break out past the 45 or 55 values showing an indecisive market.
Such compressive price action meant a sharp move was around the corner, but its direction was uncertain. On higher timeframes such as daily, the market structure of ETH was bearish. The H4 bearish order block at $1880 could be tested before a move downward. Traders must also beware of liquidity hunts in either direction before a reversal.
Therefore, the high a
Go to Source to See Full Article
Author: Akashnath S
Tip BTC Newswire with Cryptocurrency
Donate Bitcoin to BTC Newswire

Donate Bitcoin Cash to BTC Newswire

Donate Ethereum to BTC Newswire

Donate Litecoin to BTC Newswire

Donate Monero to BTC Newswire

Donate ZCash to BTC Newswire


