Disclaimer: The information presented does not constitute financial, investment, trading, or other types of advice and is solely the writer’s opinion.
- Ethereum volume indicators showed selling pressure was dominant, but the on-chain metrics showed otherwise.
- Combined with the lack of a strong trend, a bullish resurgence was possible in the coming weeks.
Ethereum [ETH] saw a sizeable drop in its volatility in recent months. While investors with a higher time horizon can see this as a positive development, traders would be more inclined to lament the lack of volatility.
Read Ethereum’s [ETH] Price Prediction 2023-24
Technical indicators showed that there was steady selling pressure behind the asset over the past month. Analysis of the price action outlined areas where a bullish revival could occur. Here’s what traders can be prepared for.
Ethereum is stuck within a short-term range but the longer-term outlook remains bullish
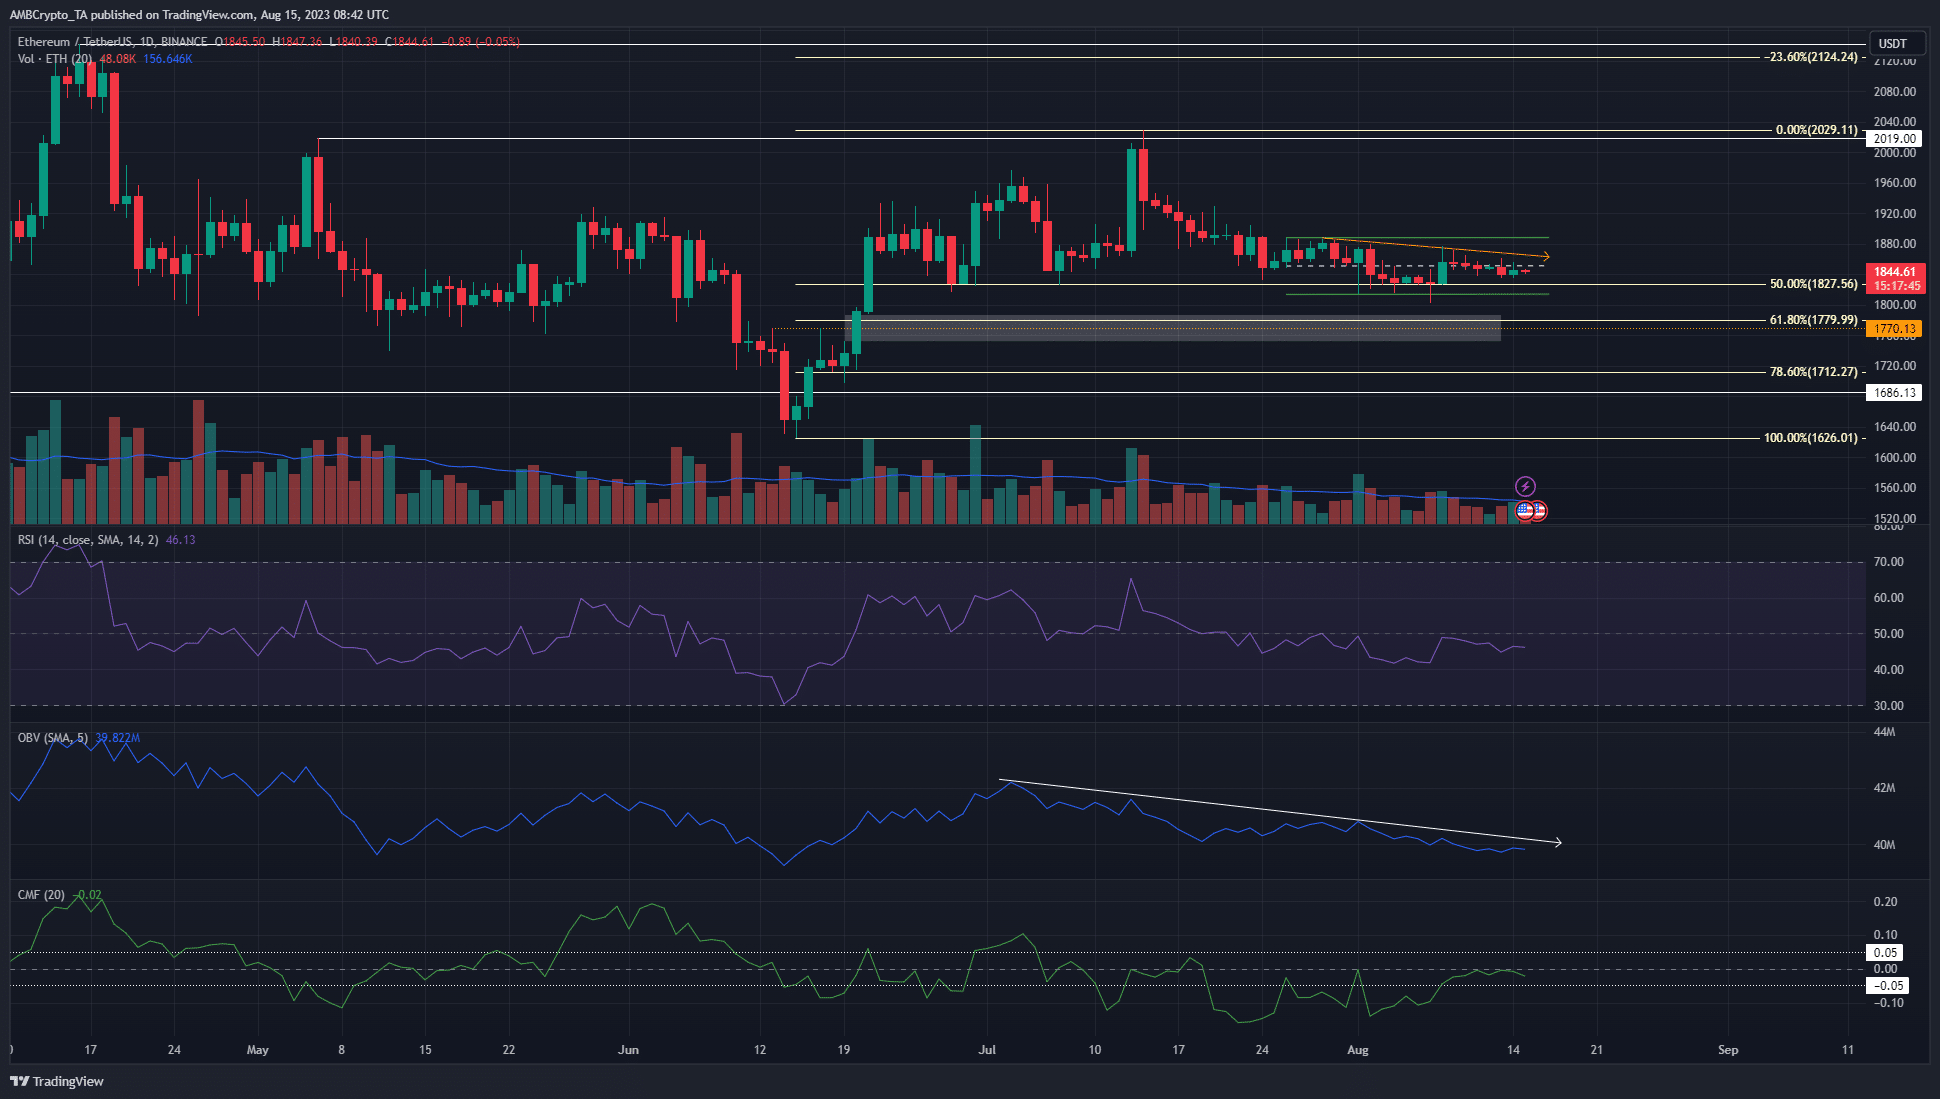
The 1-day chart showed that ETH has a bearish market structure. This came after ETH fell below the $1833 level on 1 August. On lower timeframes, ETH has been in a steady downtrend since mid-July.
However, the trend on the 1-day chart was not yet bearish. There was no strong trend at the moment but the bulls are favored in the coming weeks. This was because the Ethereum rally to $2029 in July showed bullish intent.
The Fibonacci retracement levels showed that the 61.8% and 78.6% retracement levels at $1780 and $1712 will likely serve as support levels. The FVG (white box) on the daily chart at $1770 added confluence. These levels would be the ones to watch out for if ETH sank below $1815, a level the bulls have defended
Go to Source to See Full Article
Author: Akashnath S
Tip BTC Newswire with Cryptocurrency
Donate Bitcoin to BTC Newswire

Donate Bitcoin Cash to BTC Newswire

Donate Ethereum to BTC Newswire

Donate Litecoin to BTC Newswire

Donate Monero to BTC Newswire

Donate ZCash to BTC Newswire


