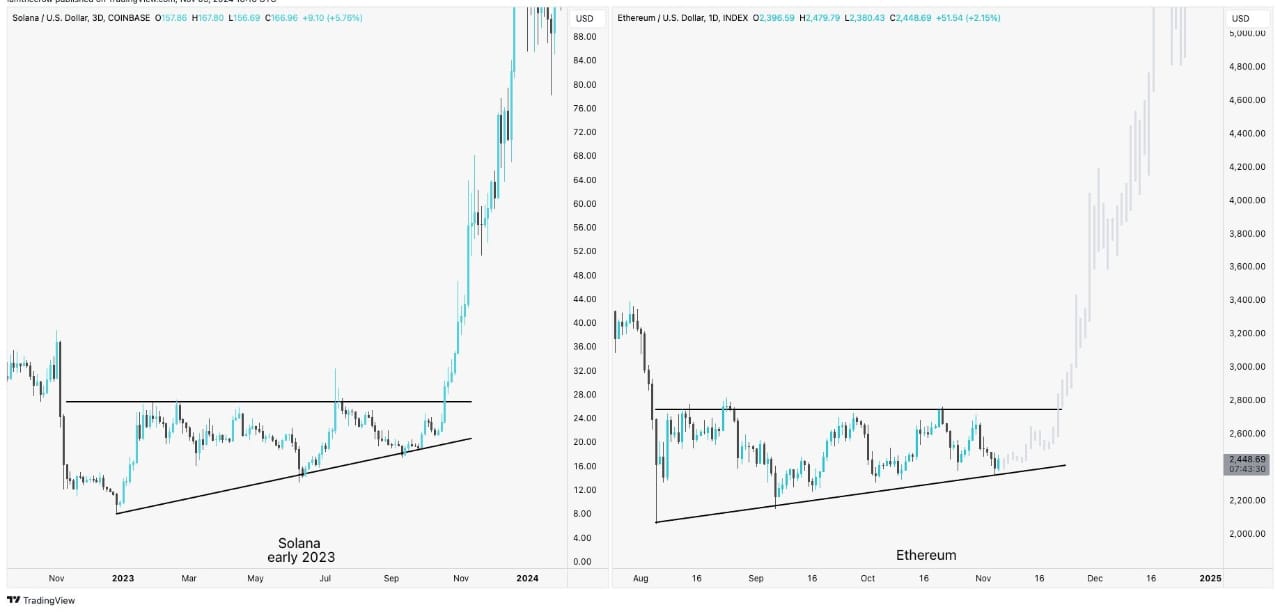
- Ethereum mirroring Solana’s exact structure, a triangle below its resistance level.
- The multiple liquidity grab that occurred on ETH could spark a rally.
The comparison of Ethereum [ETH] and Solana [SOL] charts reveal a notable similarity between the recent price action of ETH and that of SOL in early 2023.
Solana’s price in early 2023 formed an ascending triangle, consolidating beneath resistance before ultimately breaking out, resulting in a substantial rally of over 222%.
As of press time, Ethereum was mirroring this exact structure—forming an ascending triangle beneath its resistance level, showing similar buildup and consolidation.
Given this pattern alignment, Ethereum could potentially be on the cusp of a major bullish breakout if it follows the same trajectory as Solana did.
Source: Trading View
The ascending triangle often traded as a bullish continuation pattern suggests a breakout could propel ETH significantly higher. Momentum indicators and trader activity would need to align for ETH to achieve comparable gains.
Should Ethereum break above the current resistance zone, it might lead to a strong rally, targeting similar upside percentages, positioning ETH for another significant uptrend.
The RSI and MACD indicators suggest…
Additionally, the Ethereum the relative strength index and moving average divergence convergence indicators points towards potential market strength.
The RSI was hovering near a neutral to slightly bullish territory, suggesting momentum may start leaning upwards. The histogram for the MACD indicator was showing diminishing red bars, hinting that bearish pressure could be weakening.
Additionally, the MACD line appears to be nearing a crossover above the signal line, which is a common bullish signal.
Author: Lennox Gitonga