
The Ethereum (ETH) price has bounced at a nearly 500-day ascending support trendline.
Ethereum broke out above a shorter-term descending resistance trendline shortly after the bounce.
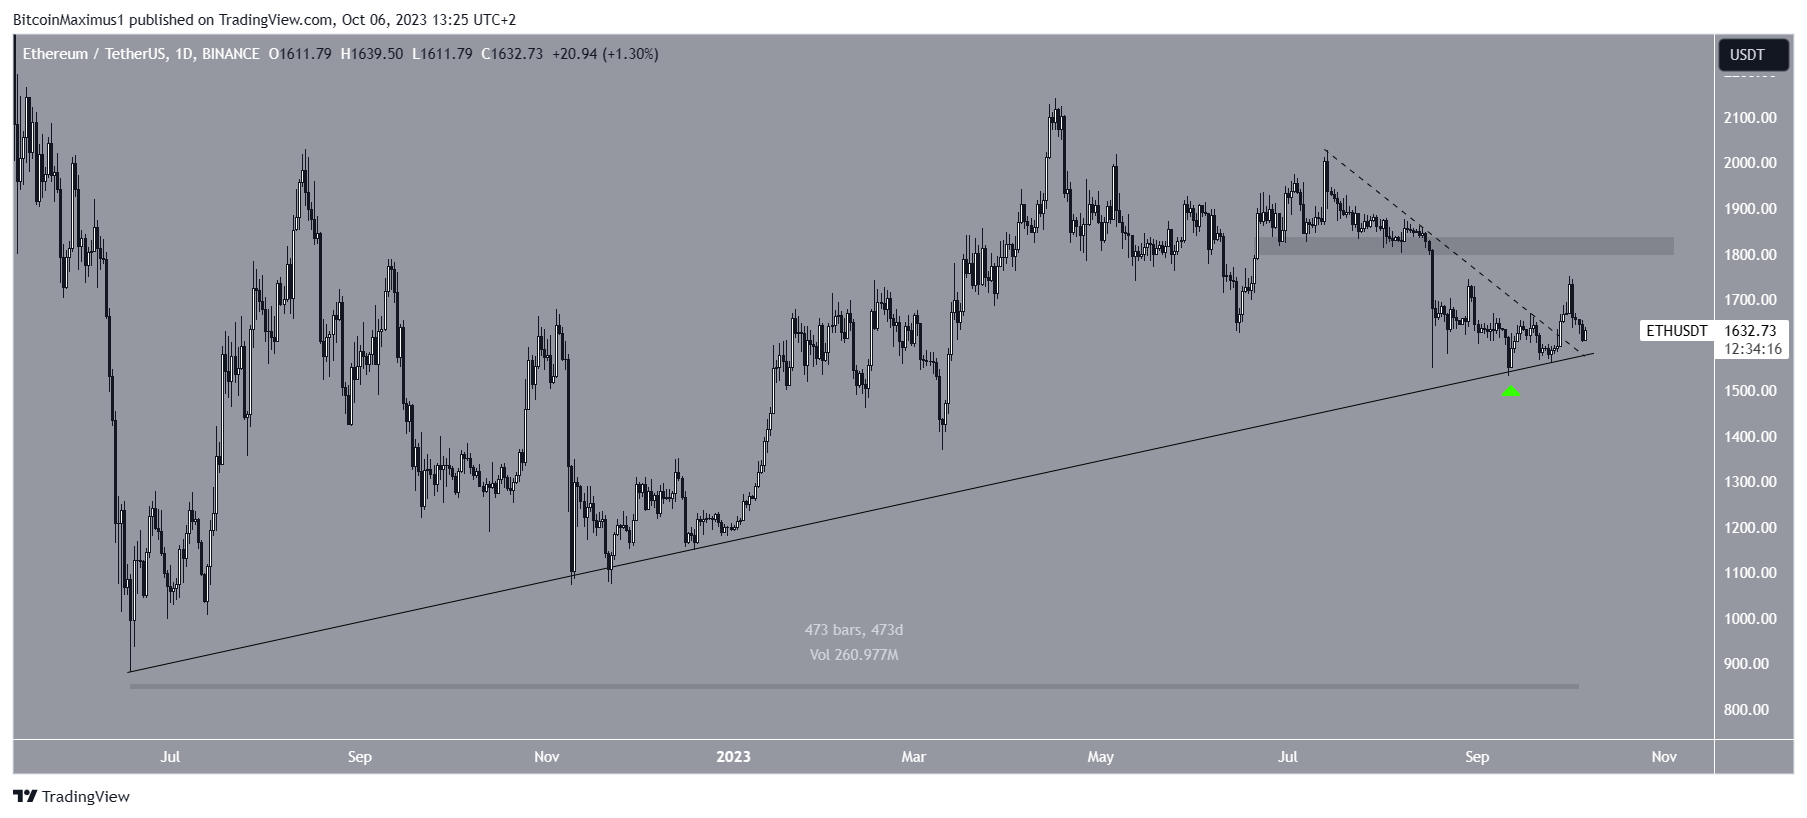
Ethereum Bounces at Nearly 500-Day Support
The daily time frame chart shows that the ETH price has increased since September 11. At the time, it bounced (green icon) at a long-term ascending support trendline, which has been in place for 473 days.
Crypto investing, simplified. Get Ethereum (ETH) price predictions here.
After creating a higher low, the ETH price broke out from a shorter-term descending resistance trendline on September 28. The breakout led to a high of $1,751 on October 1.
However, the price has fallen in the days since. A similar decrease has been seen in the rest of the crypto market.
After the price clears an important trendline, it sometimes returns to validate it as support before resuming its previous movement, as has been the case for ETH so far.
Go to Source to See Full Article
Author: Valdrin Tahiri
Tip BTC Newswire with Cryptocurrency
Donate Bitcoin to BTC Newswire

Donate Bitcoin Cash to BTC Newswire

Donate Ethereum to BTC Newswire

Donate Litecoin to BTC Newswire

Donate Monero to BTC Newswire

Donate ZCash to BTC Newswire


