ETH price has formed a highly bullish continuation pattern, a confirmed breakout above which could potentially push the token to a new all-time high in the coming months.
Summary
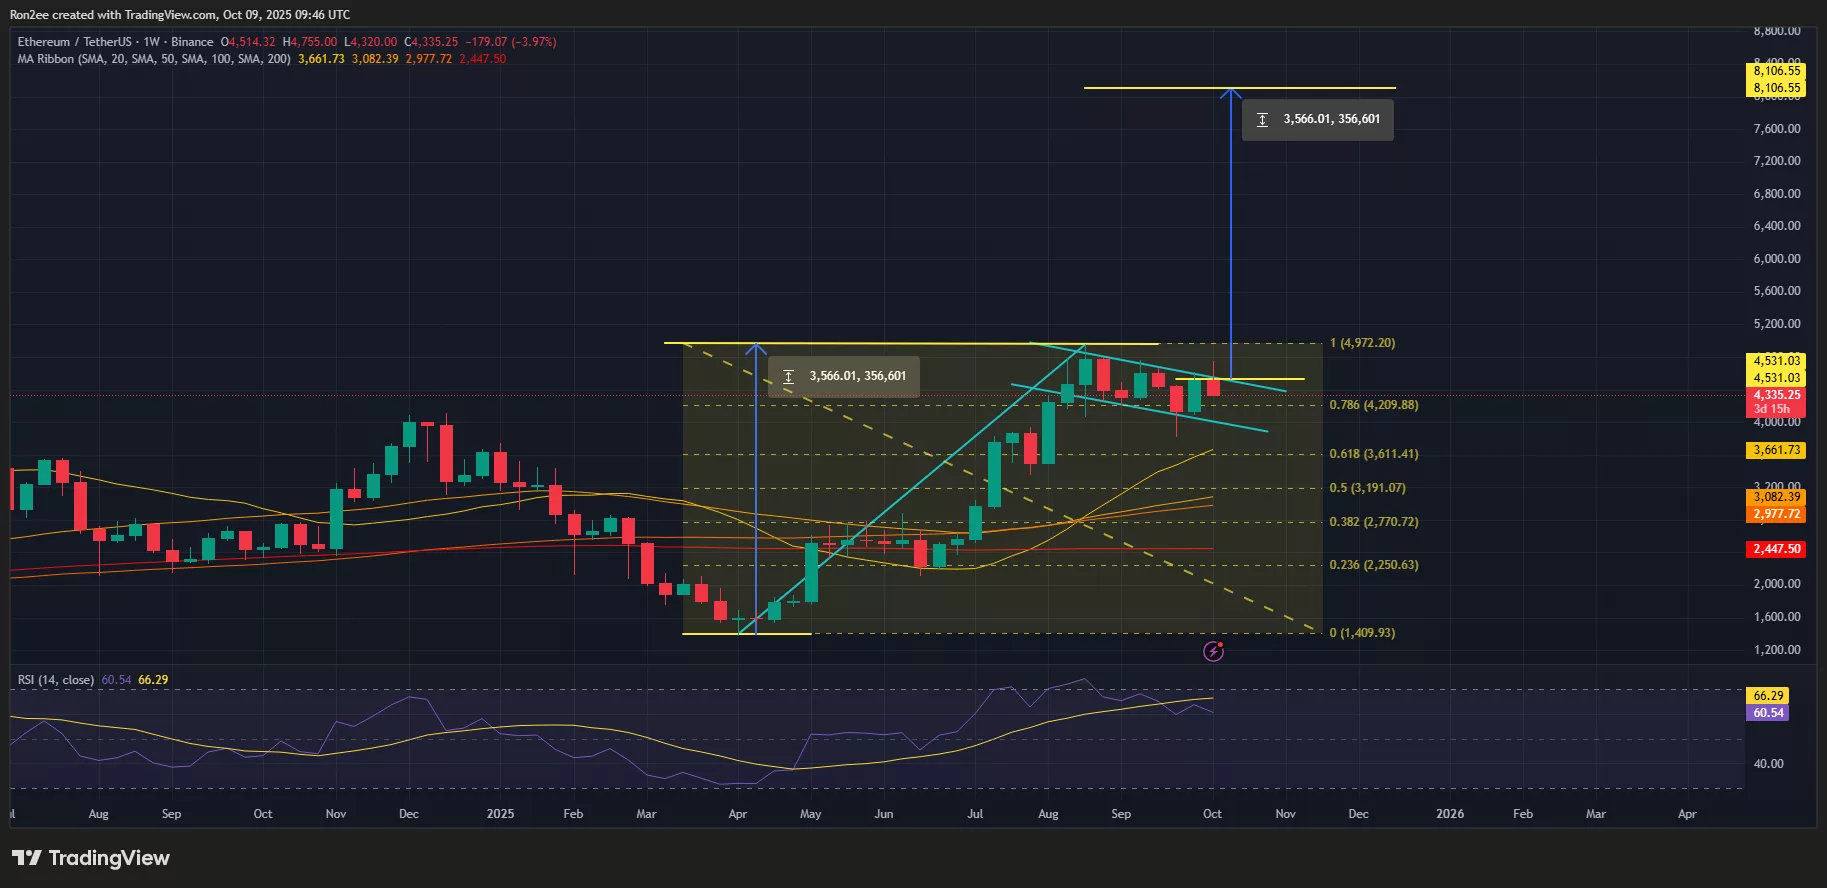
- ETH price is down roughly 9% after failing to breach the $4,700 resistance earlier this week.
- A multi-month bull flag pattern has formed on the weekly chart.
According to data from crypto.news, Ethereum (ETH) price fell 4% to an intraday low of $4,329 on Oct. 9 afternoon Asian time after bulls failed to breach the $4,600 resistance level late last night. At its current price, the token is down approximately 9% from its weekly high of $4,753, reached on Tuesday on the back of project-specific catalysts and a broader market rally sparked by renewed optimism across the crypto space.
The rally was fueled in part by the historically bullish sentiment that surrounds October, a month known for strong seasonal gains for cryptocurrencies. Strong inflows into spot Ethereum ETFs and macro tailwinds, such as expectations of dovish central bank policies, also contributed to the upbeat momentum.
However, the tide began to shift on Oct. 7, as Ethereum failed to break past the $4,700 resistance level for the second time over the past 30 days. The pullback was triggered by a combination of profit-taking by short-term traders, broad-based market liquidations, and a resurgent U.S. dollar, all of which weighed on investor sentiment and put downward pressure on ETH’s price.
As ETH price continued to slide downward following the recent rejection at higher levels, it has now formed a giant bullish flag pattern on the weekly chart. In technical analysis, this pattern emerges when an asset’s price rallies sharply and then consolidates in a downward-sloping channel, often signaling a pause before the next leg
Go to Source to See Full Article
Author: Rony Roy