
The Ethereum (ETH) price trades inside an important horizontal area previously providing resistance.
ETH also trades inside a confluence of short-term support levels, which can be key in determining the future trend.
Ethereum Falls to Channel’s Support
The technical analysis of the daily time frame shows that the ETH price has traded inside an ascending parallel channel for the past 95 days. The upward movement led to a high of $2,717 on January 12. The high validated the channel’s resistance trend line (red icon).
However, Ethereum has fallen since and trades close to the pattern’s support trend line. Currently, ETH trades inside an important horizontal area that previously provided resistance. A bounce would validate it as support.
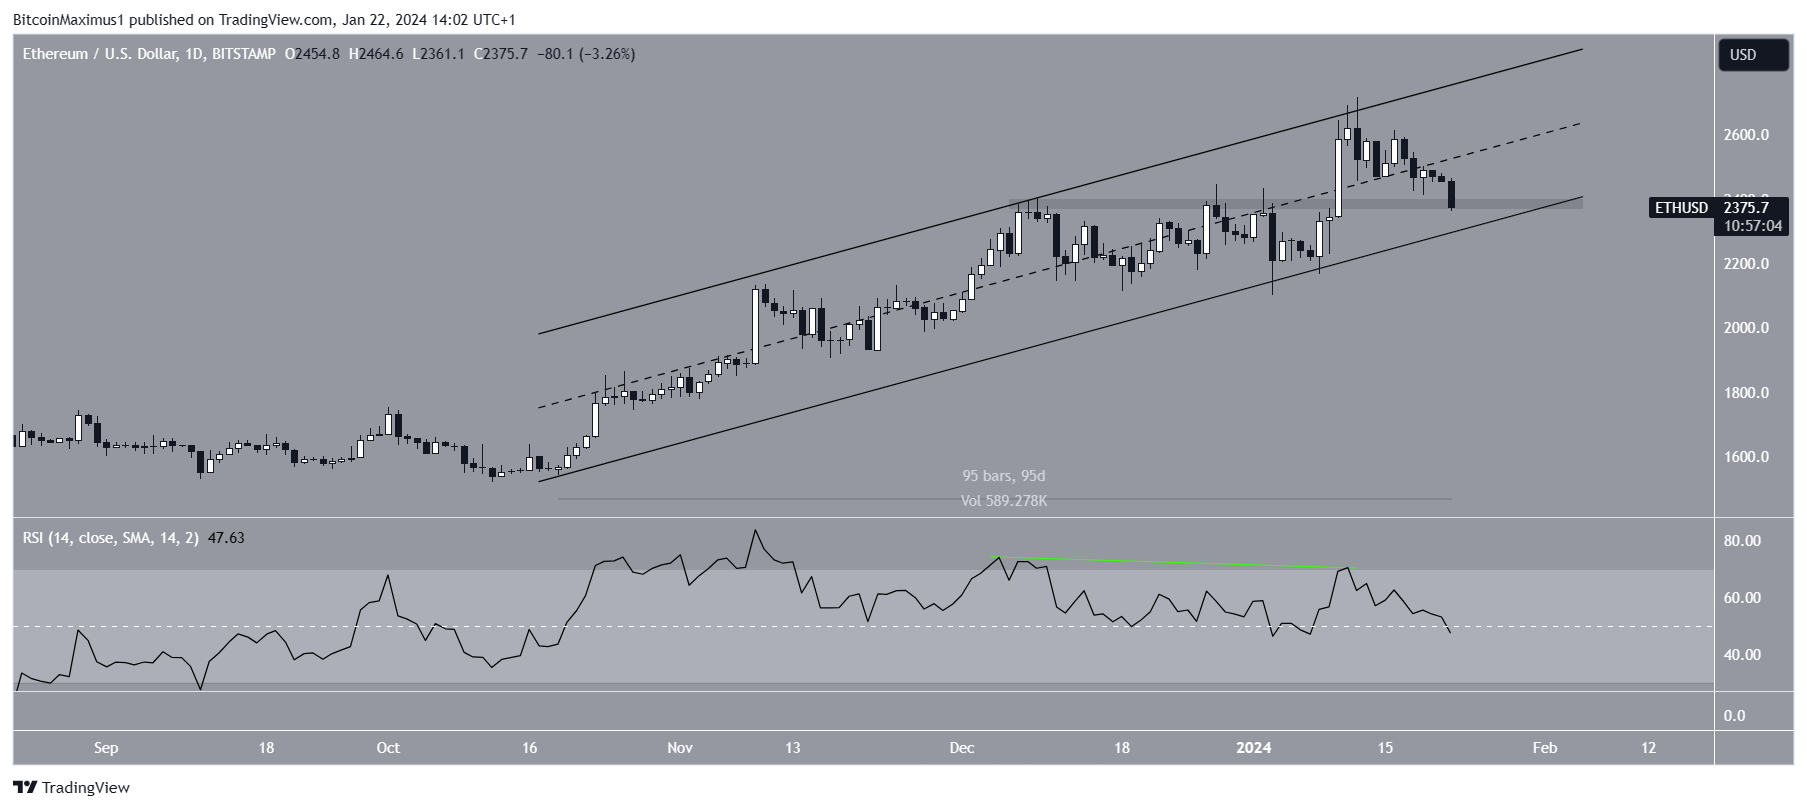
The daily Relative Strength Index (RSI) is bearish. When evaluating market conditions, traders use the RSI as a momentum indicator to determine whether a market is overbought or oversold and whether to accumulate or sell an asset.
If the RSI reading is above 50 and the trend
Go to Source to See Full Article
Author: Valdrin Tahiri
Tip BTC Newswire with Cryptocurrency
Donate Bitcoin to BTC Newswire

Donate Bitcoin Cash to BTC Newswire

Donate Ethereum to BTC Newswire

Donate Litecoin to BTC Newswire

Donate Monero to BTC Newswire

Donate ZCash to BTC Newswire


