
Ethereum’s (ETH) price has fallen since reaching a high of $2,720 on January 12. The decrease continued for 11 days.
ETH has traded inside a horizontal range for the past 61 days. Will it break out or down?
Ethereum Fails to Clear Resistance
The weekly time frame technical analysis shows that ETH has increased since June 2022. During this time, it created three higher lows (green icons), each accelerating the increase afterward.
The Ethereum price increase culminated with a high of $2,720 in January 2024. The high was above the 0.382 Fib retracement resistance level and a horizontal resistance area.
However, ETH fell below the area afterward, making the previous movement a deviation. ETH still trades below this resistance area.
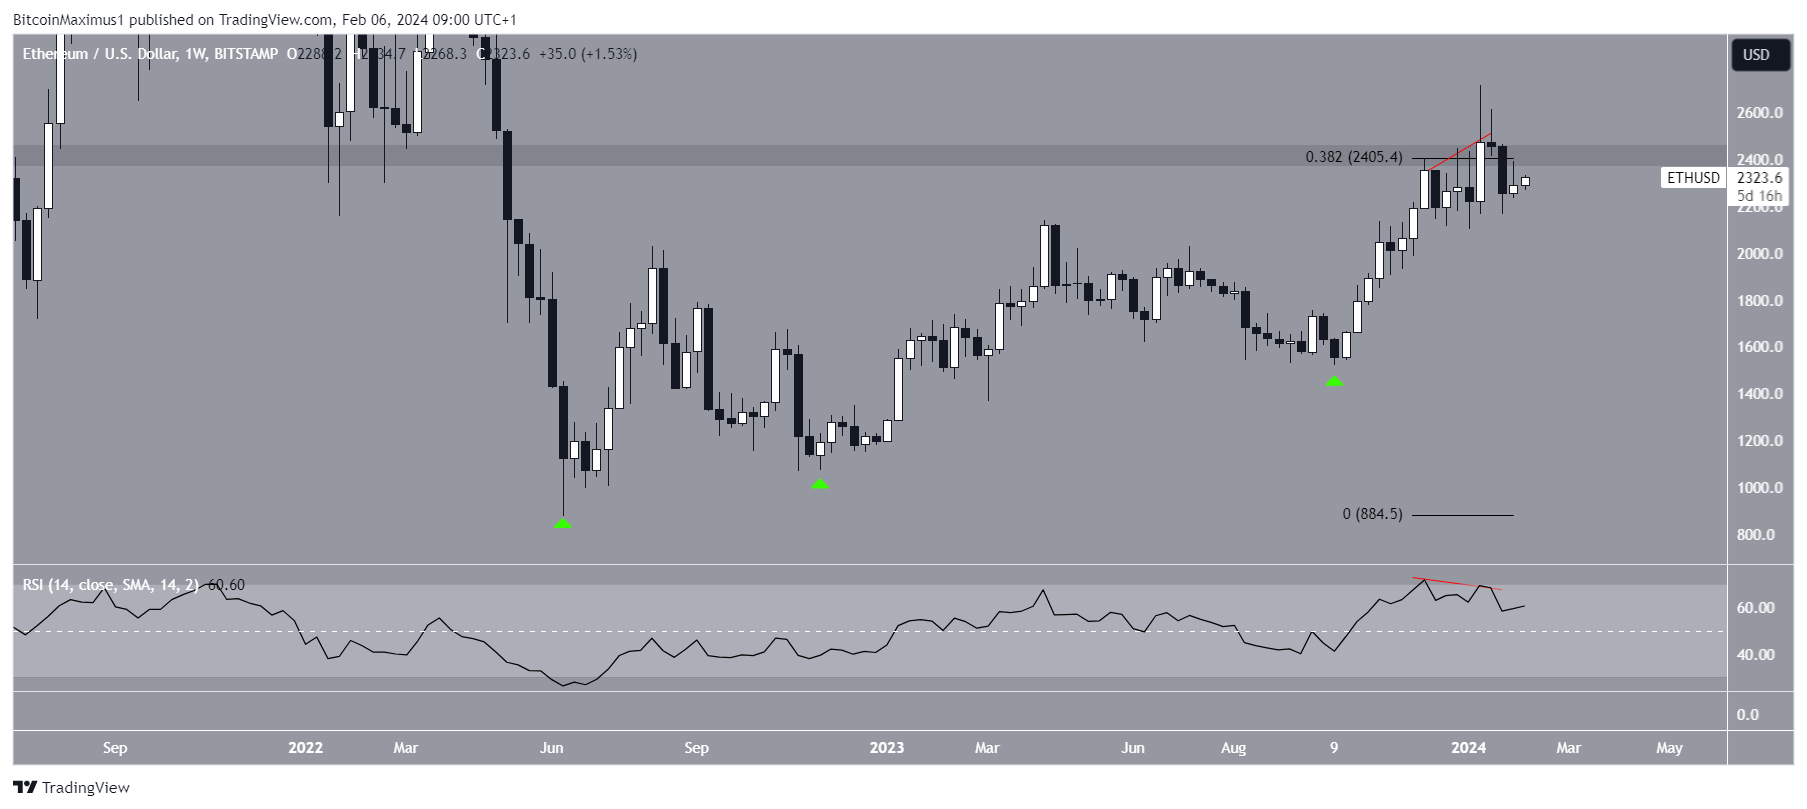
The weekly Relative Strength Index (RSI) is leaning bearish. Marke
Go to Source to See Full Article
Author: Valdrin Tahiri
Tip BTC Newswire with Cryptocurrency
Donate Bitcoin to BTC Newswire

Donate Bitcoin Cash to BTC Newswire

Donate Ethereum to BTC Newswire

Donate Litecoin to BTC Newswire

Donate Monero to BTC Newswire

Donate ZCash to BTC Newswire


