- ETH’s short-term outlook shows signs of a bullish reversal around the $3,000 psychological level.
- On-chain metrics suggest selling pressure, but most ETH holders remain in profit.
Ethereum [ETH] was also hit by the recent altcoin correction, dipping over 20% after being rejected at the $4,000 resistance level.
However, this downtrend may not be significant, as Ethereum’s technical patterns and on-chain metrics show mixed signals of a potential price recovery or further volatility.
ETH approaching key support at $2.8k
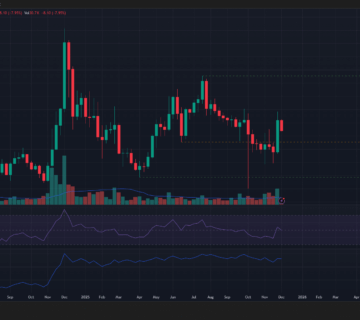
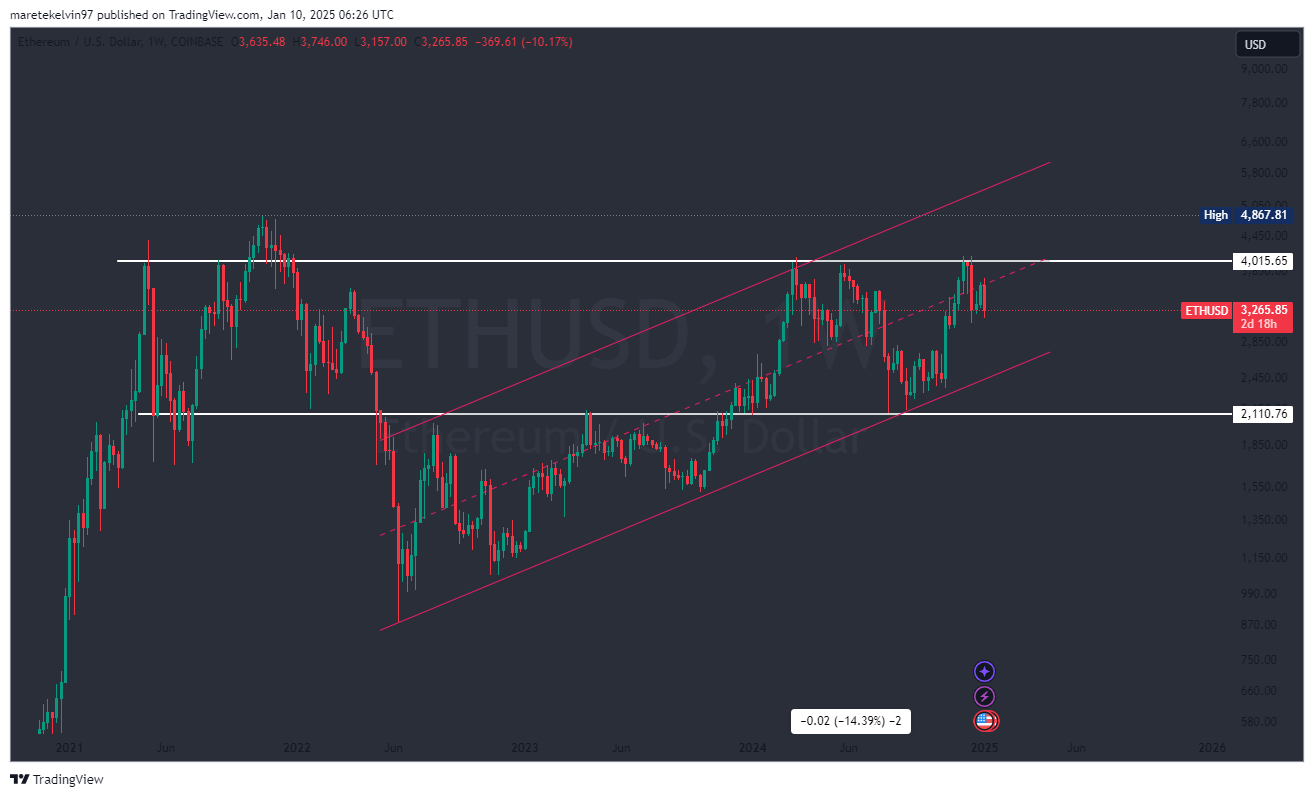
On the weekly chart, Ethereum’s price movement shows consolidation in a bullish flag pattern—a pattern that often precedes a breakout. The recent dip has brought ETH close to the lower boundary of this ascending flag at $2,800.
If this level holds strong, it could act as a springboard for a massive upward rally. A successful rebound here may push Ethereum toward its next key target of $6,000.
However, failure to maintain this support could expose ETH to further downside.
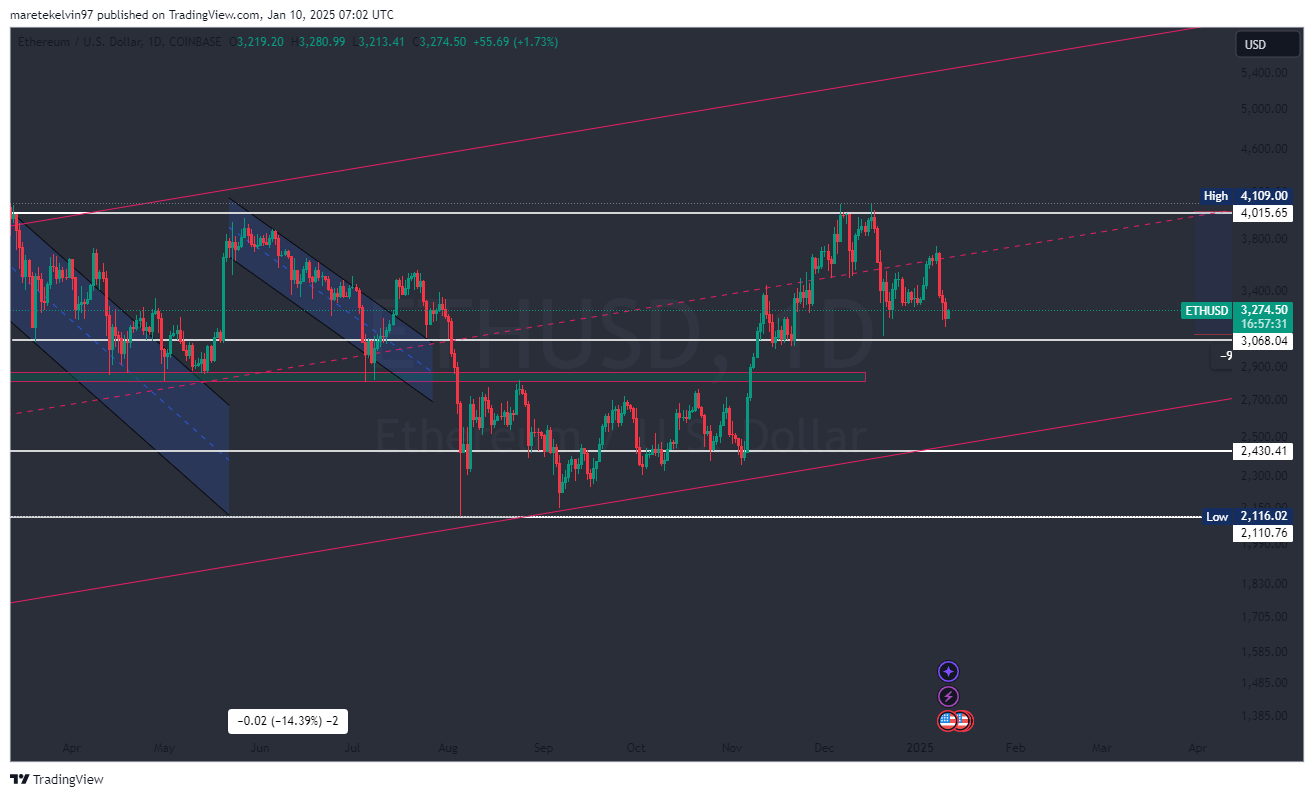
Signs of a short-term reversal at $3,000
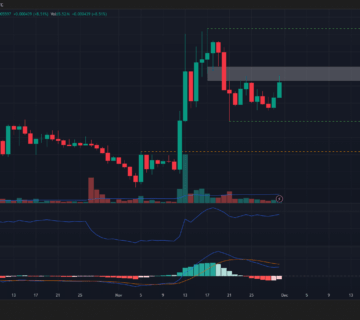
Zooming down to the daily chart, Ethereum’s price action indicates a potential short-term bullish reversal.
The $3,000 psychological level appears pivotal, as ETH trading activity has increased slightly over the last 24 hours.
Go to Source to See Full Article
Author: Kelvin Murithi