- The double bottom chart pattern positions $0.47 as a critical breakout level.
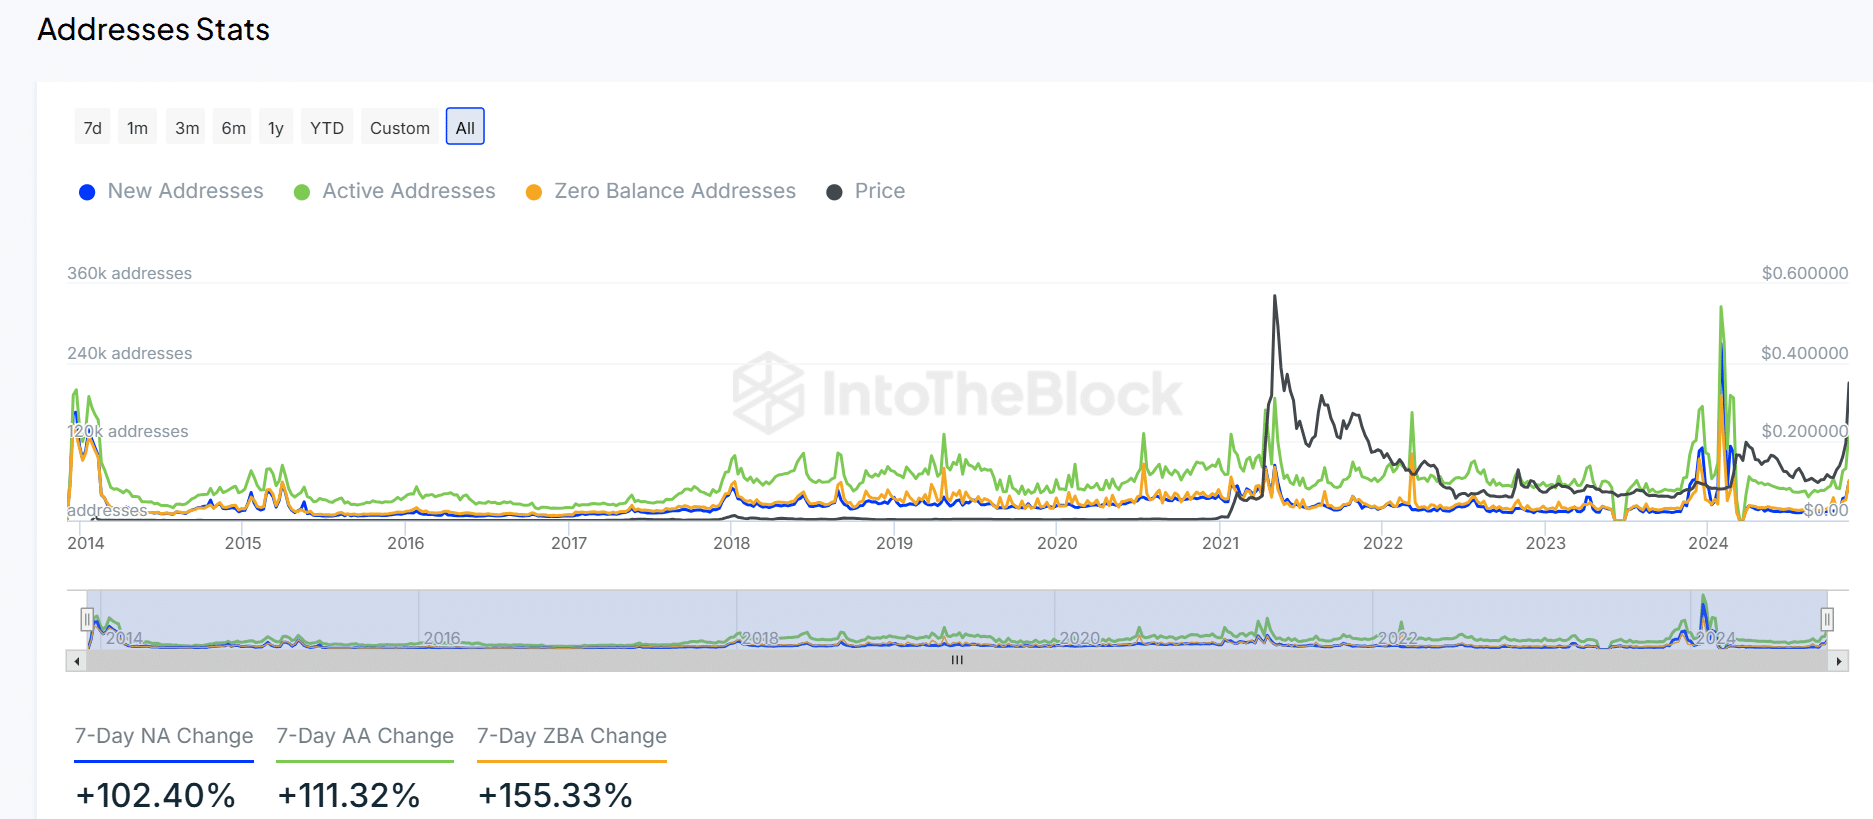
- Network activity surges with a 102.4% increase in new addresses and steady transactions.
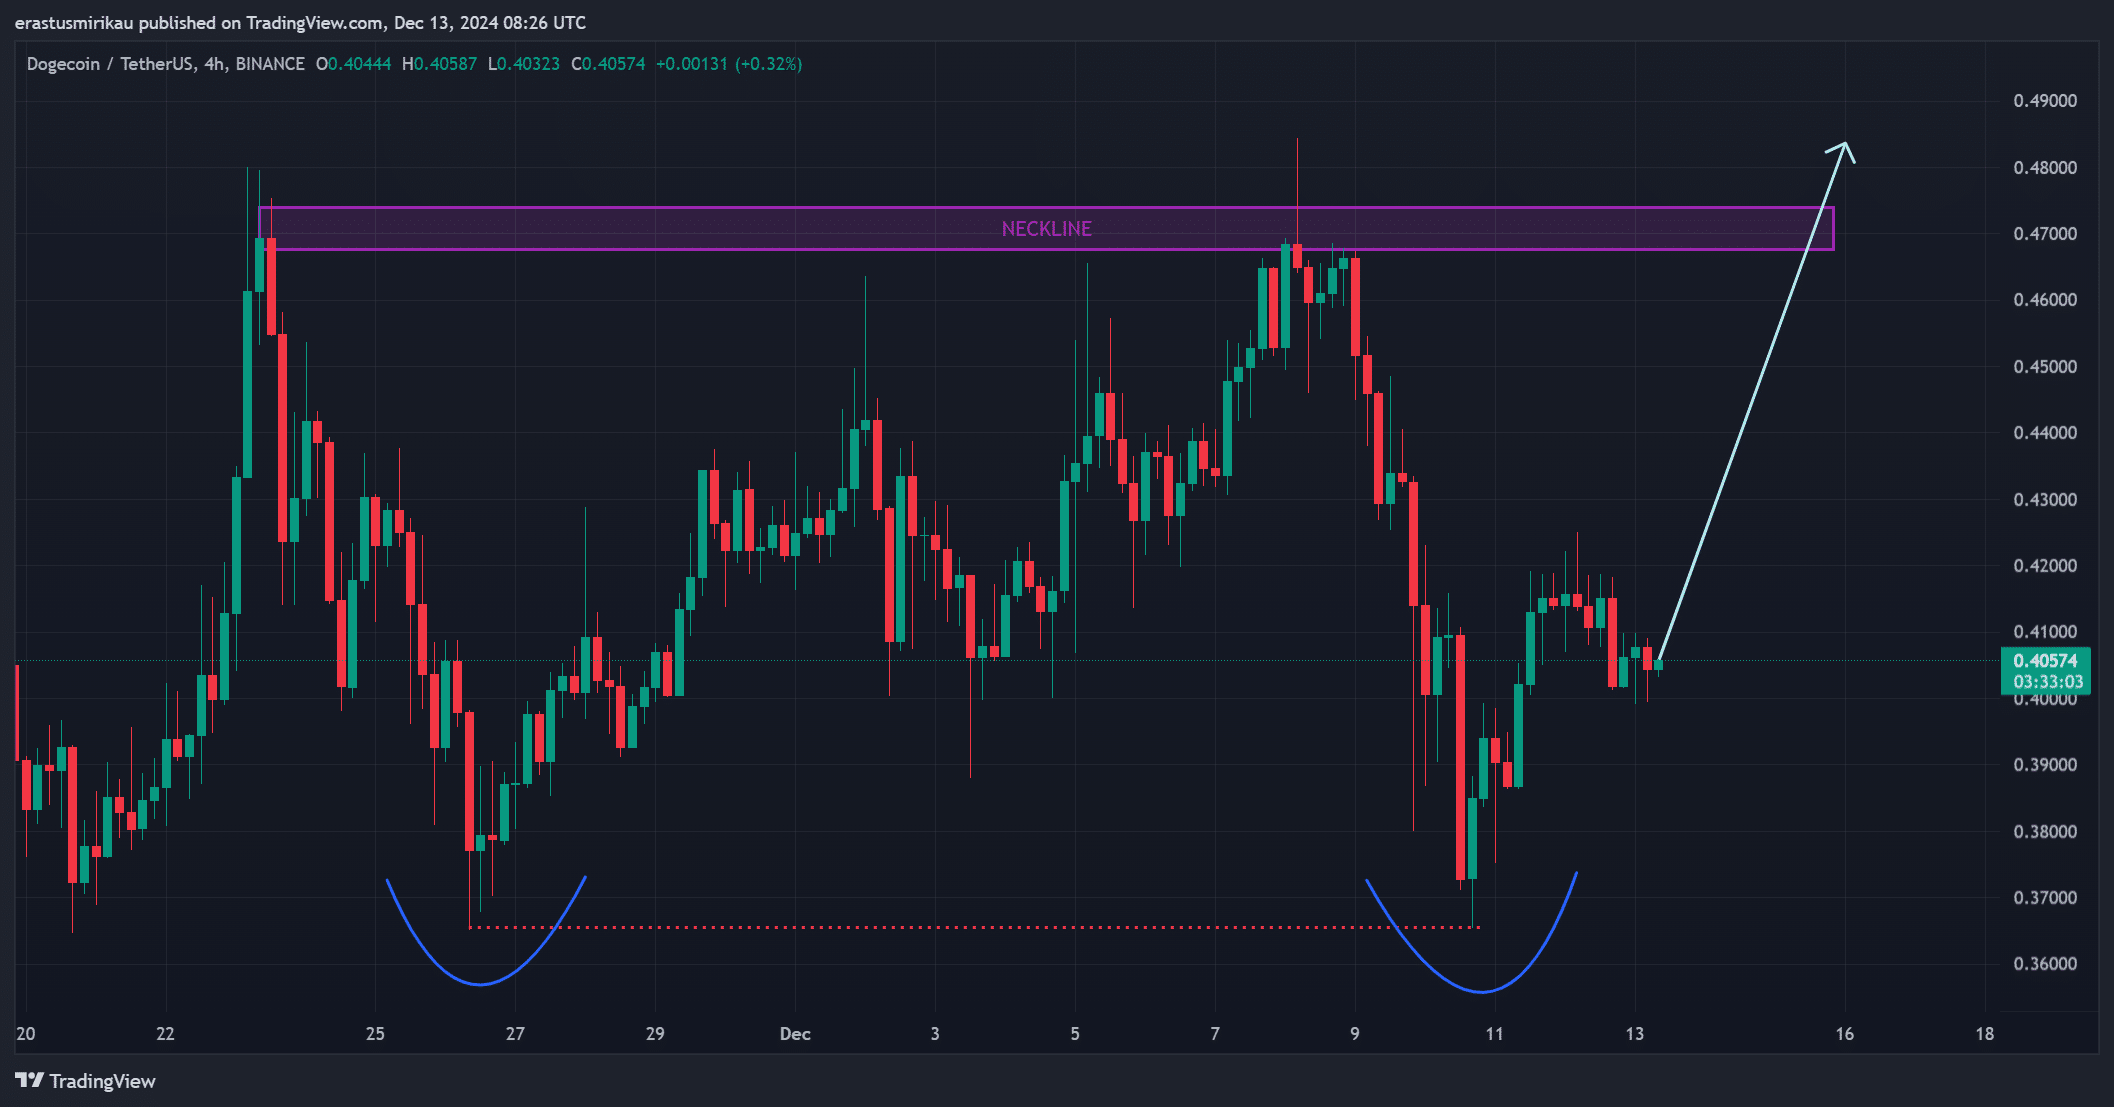
Dogecoin [DOGE] is making headlines as it forms a compelling double bottom chart pattern, often a precursor to bullish momentum. At press time, Dogecoin was trading at $0.4043, reflecting a 2.68% decline in the last 24 hours.
However, its recent surge in network activity and a strong technical setup suggest growing interest among traders and investors, raising the question of whether a breakout is imminent.
DOGE chart outlook: Can $0.47 be breached?
The double bottom pattern highlights a solid support level at $0.37, while the neckline resistance at $0.47 represents a key hurdle for Dogecoin to overcome.
Therefore, breaking above this resistance could confirm the bullish setup and potentially lead to a rally toward $0.50 or higher. With traders closely monitoring this level, Dogecoin’s short-term momentum hinges on its ability to break out decisively.
Source: TradingView
New addresses and active wallets surge significantly
Additionally, Dogecoin’s on-chain metrics reveal a dramatic rise in network activity. Over the past week, new addresses have increased by 102.4%, while active addresses have surged by 111.32%.
These spikes suggest a wave of new participants entering the Dogecoin ecosystem and heightened engagement from existing users.
Furthermore, zero-balance addresses, an indicator of new wallet creations, have grown by an impressive 155.33%, further solidifying the narrative of increased adoption.