- Dogecoin shows multiple bullish signals, notably with the RSI on the 4-hour chart.
- DOGE’s activity has been steady, with daily active addresses and whale movements at key levels.
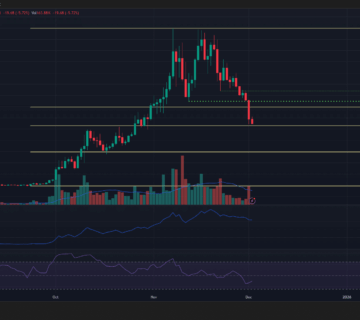
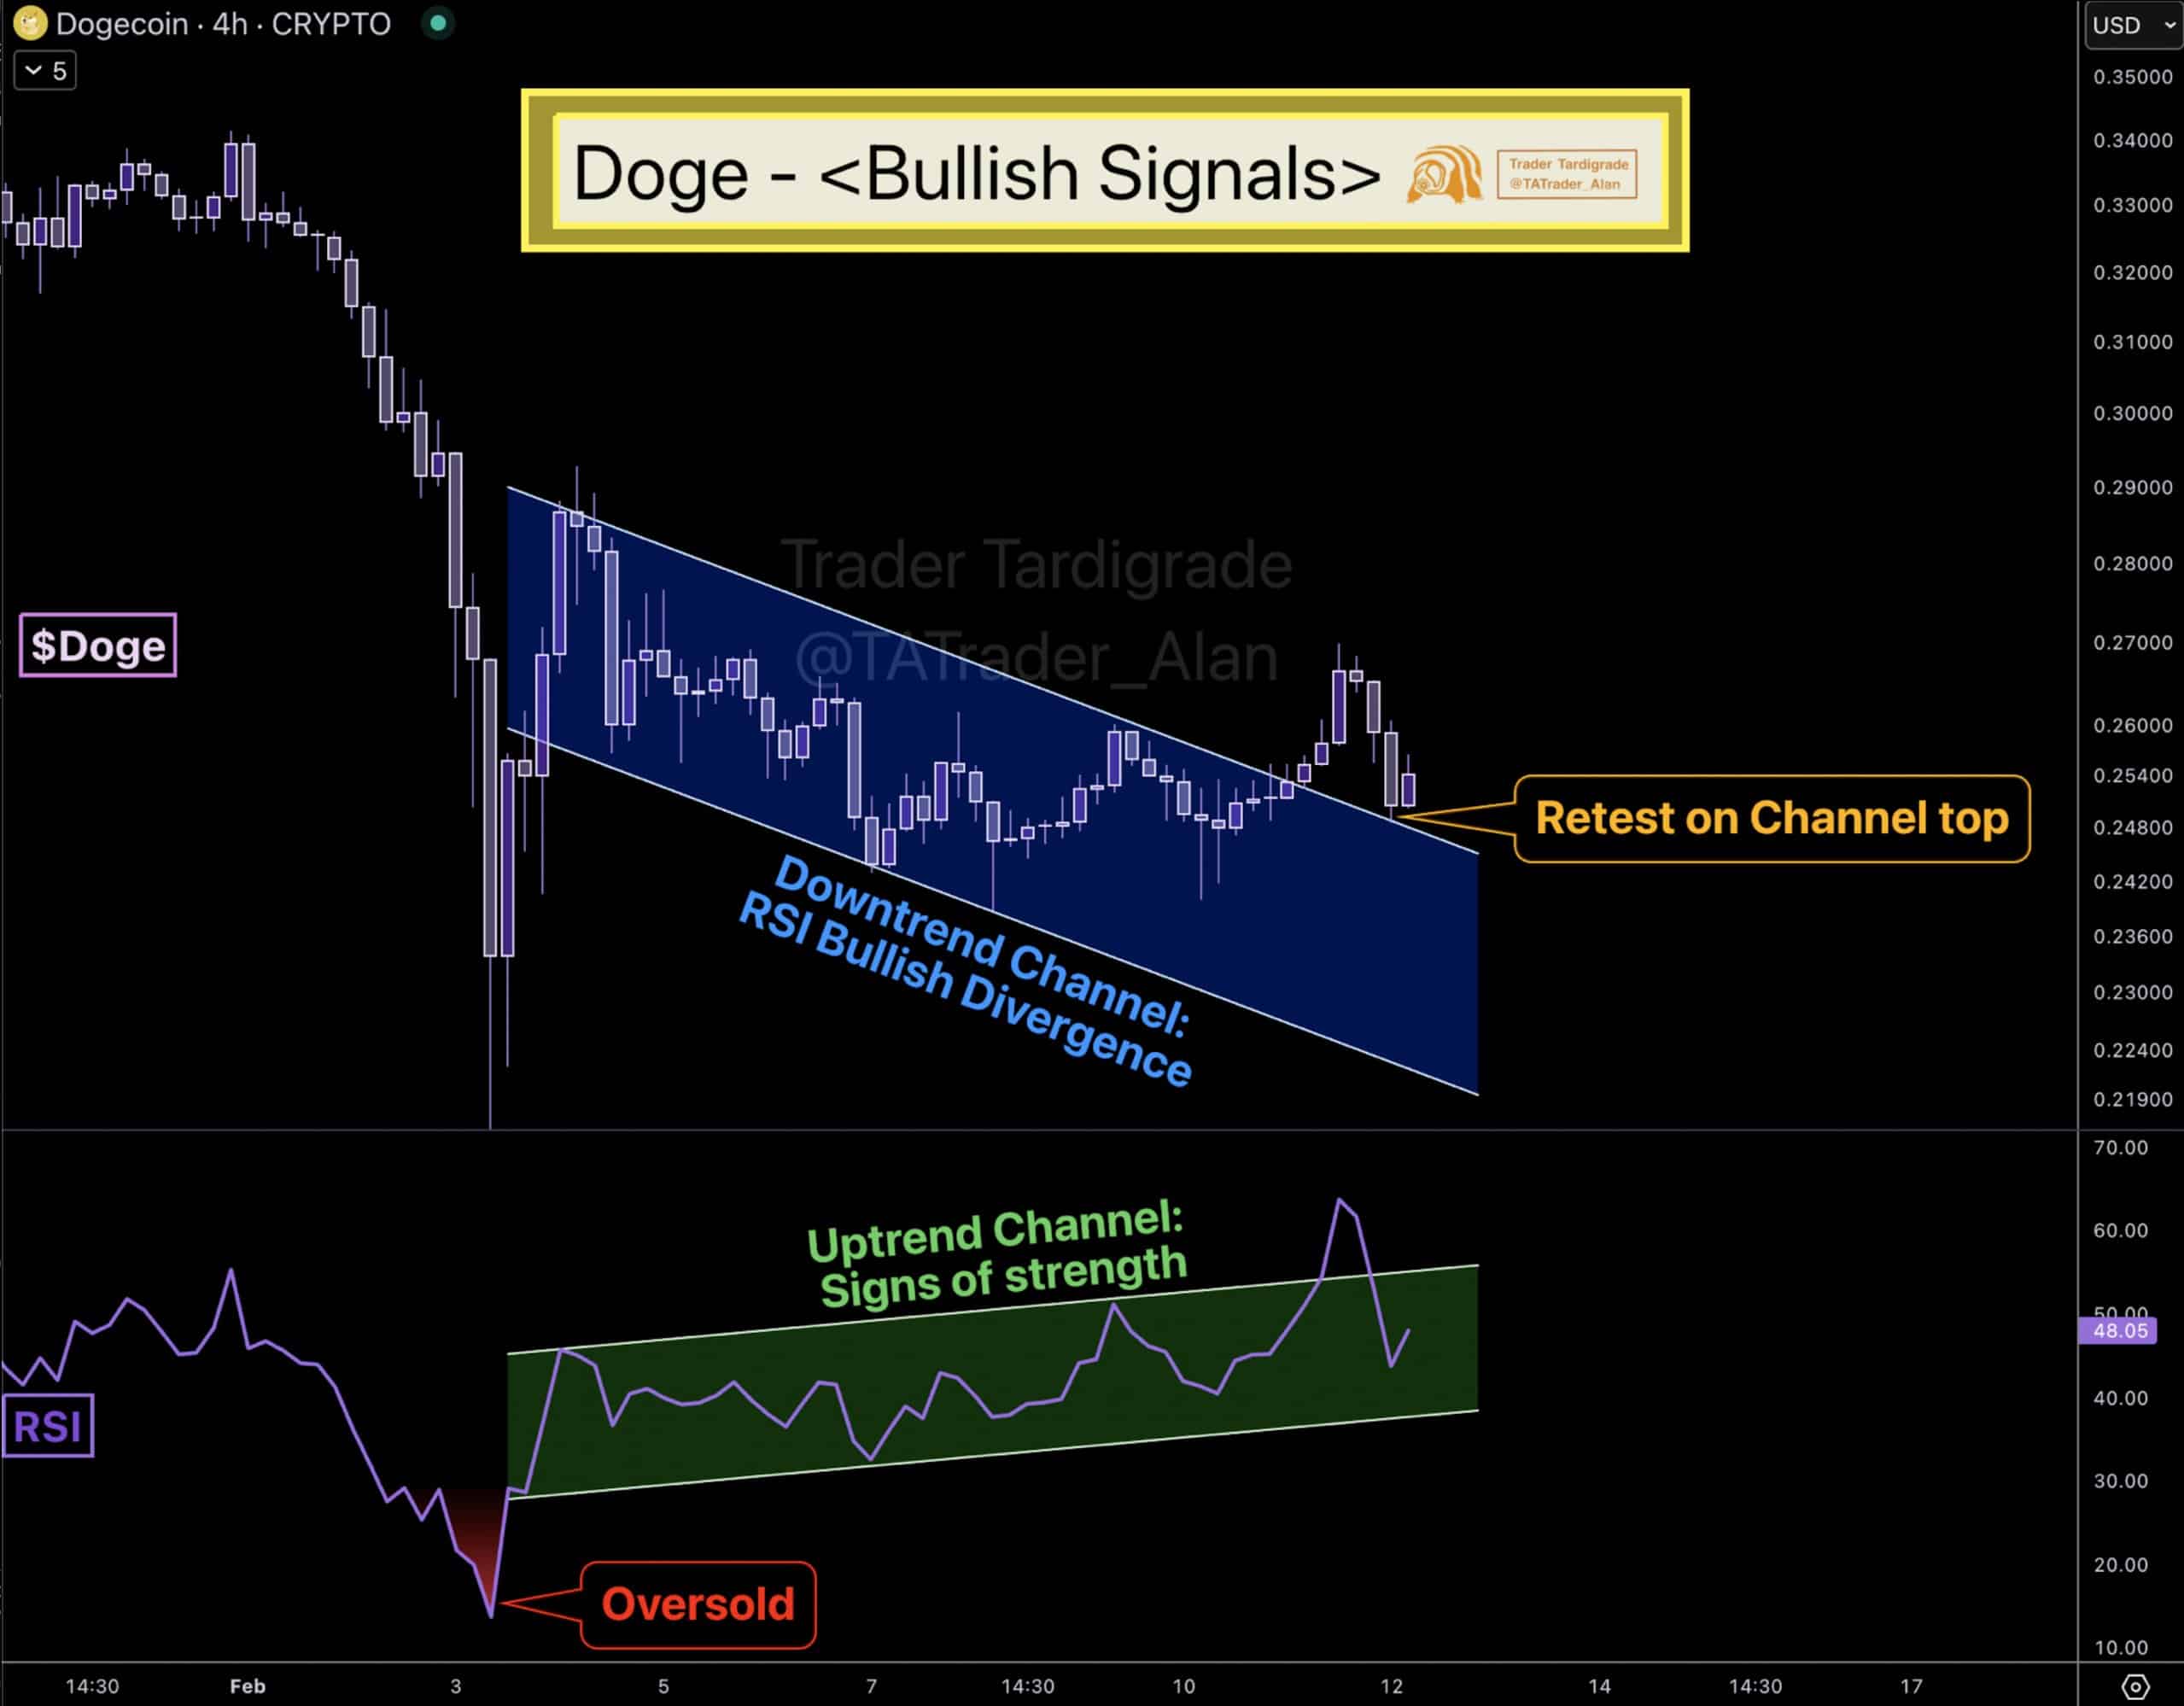
Dogecoin’s [DOGE] chart revealed critical bullish signals through its 4-hour Relative Strength Index (RSI) and price channels.
The RSI, deeply entrenched in the oversold territory with a reading near 48 at press time, suggested a potential turnaround for Dogecoin’s price.
This was reinforced by the RSI’s upward-trending channel, indicating a strengthening momentum despite the downtrend in DOGE’s price channel.
Furthermore, DOGE showed a bullish divergence as it retested the top of its broken channel, near $0.255 at the time of writing.
This retest represented a critical moment—either confirming a bullish reversal or failing, which could resume the downtrend.
If the ‘king of memecoins’ sustains above the channel top, it could ignite a rally towards the next resistance at $0.27. If the price breaks above $0.27, DOGE could return to $0.5 level and potentially $1 before mid-year.
Conversely, a failure to hold above the retested level could see DOGE slide back to support around $0.24, reiterating the volatility and speculative nature of the memecoin.
Each move, whether a break or a bounce, will be pivotal in determining DOGE’s trajectory in the coming days.
Dogecoin’s on-chain activity stabilizes
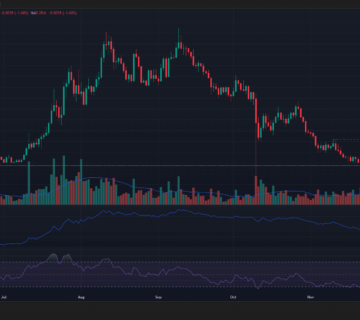
DOGE’s activity chart reflected a steady engagement level with its network despite the price fluctuations.
The number of daily active addresses consistently aligned with significant transaction volumes and whale transactions, suggesting a solid foundational interest in DOGE.
In December, daily active addresses peaked concurrently with a surge in transaction volume, indicating heightened activity that temporarily supported a pric
Go to Source to See Full Article
Author: Lennox Gitonga