
The Dogecoin (DOGE) price broke out from long- and short-term descending resistance trend lines.
Despite the breakout, the DOGE price increase stalled on Nov. 11. Will the price fall or regain its footing?
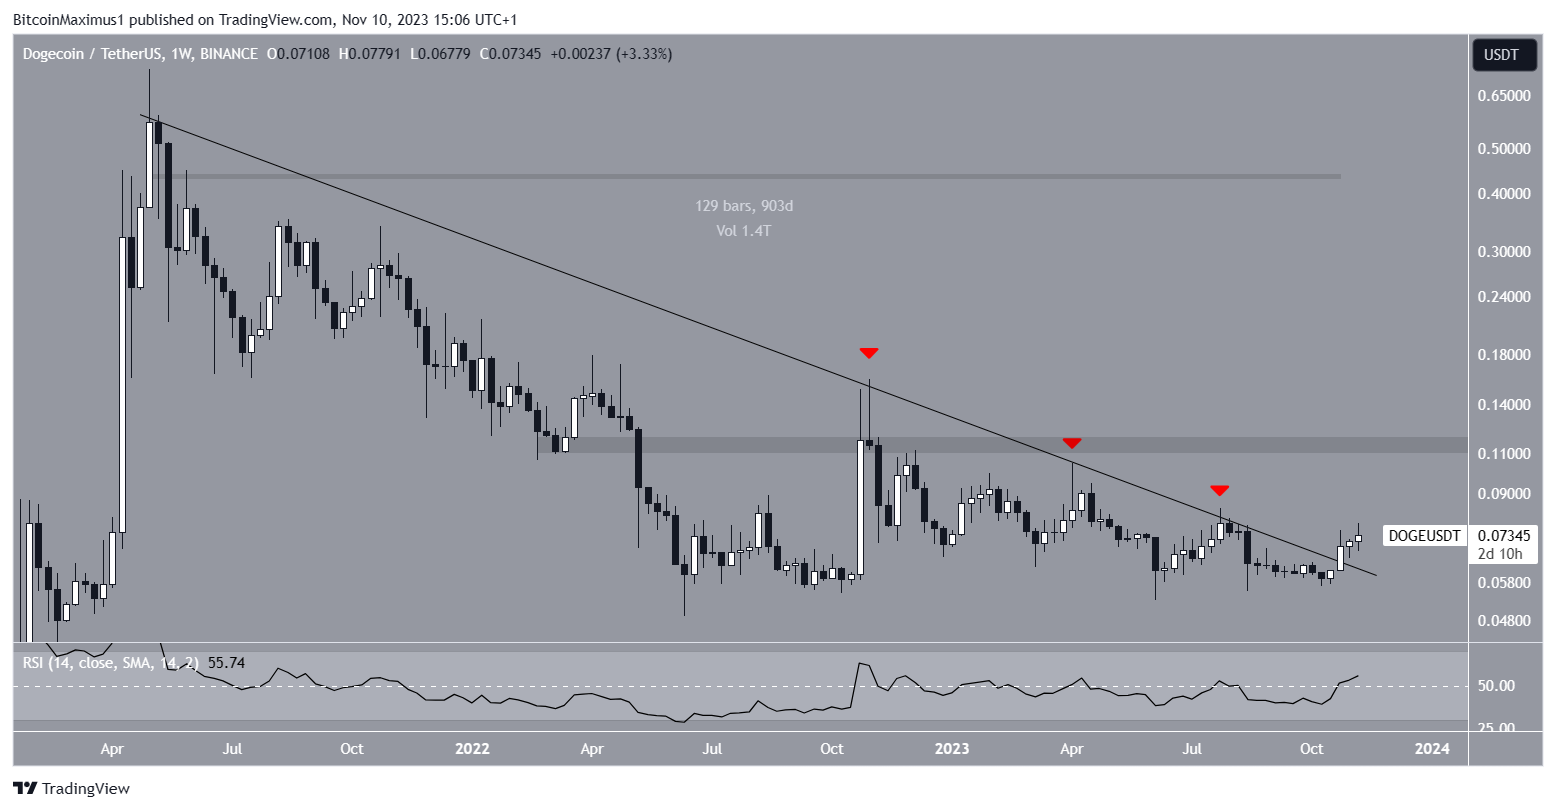
Dogecoin Clears 900-Day Resistance Trend Line
The weekly time frame technical analysis shows that the Dogecoin price broke out from a descending resistance trend line in October.
Before the breakout, the trend line had been in place for 900 days, leading to three significant rejections (red icons). After the breakout, DOGE reached a high of $0.082 before falling slightly.
Read more: (DOGE) Dogecoin Price Prediction
After the breakout, the weekly Relative Strength Index (RSI) moved above 50.
The RSI is a momentum indicator traders use to evaluate whether a market is overbought or oversold and whether to accumulate or sell an asset.
Readings above 50 and an upward trend suggest that bulls still have an advantage, while readings below 50 indicate the opposite.
A movement above 50 is a positive sign.
Go to Source to See Full Article
Author: Valdrin Tahiri
Tip BTC Newswire with Cryptocurrency
Donate Bitcoin to BTC Newswire

Donate Bitcoin Cash to BTC Newswire

Donate Ethereum to BTC Newswire

Donate Litecoin to BTC Newswire

Donate Monero to BTC Newswire

Donate ZCash to BTC Newswire


