
The recent data from IntoTheBlock indicates that Dogecoin’s network activity has experienced a significant decline over the past week, even as the price of the cryptocurrency has been rising sharply.
To assess whether this trend is indicative of a bullish or bearish market sentiment, the analysis relies on blockchain data and insights provided by IntoTheBlock, a valuable crypto tool that specializes in extracting and analyzing data directly from blockchain networks.
Dogecoin’s Dilemma: Facing a Price Correction or Poised for 30% Gain?
The current state of Dogecoin (DOGE) in the daily chart exhibits a strongly bullish trend. The cryptocurrency has successfully surpassed the golden ratio resistance near $0.082, reaching a new high. This achievement effectively concludes the previous corrective phase. Dogecoin is now encountering the next significant Fibonacci resistance level around $0.093.
Should Dogecoin break through this resistance, there is potential for an additional 30% increase in price, targeting the golden ratio level at approximately $0.12. Supporting this bullish outlook, the Moving Average Convergence Divergence (MACD) histogram is trending upwards, and the MACD lines are in a bullish crossover.
Furthermore, the Exponential Moving Averages (EMAs) display a golden crossover, reinforcing the bullish trend in the short to medium term. However, the Relative Strength Index (RSI) is indicating a bearish divergence, which might lead to a corrective price movement in the near future.
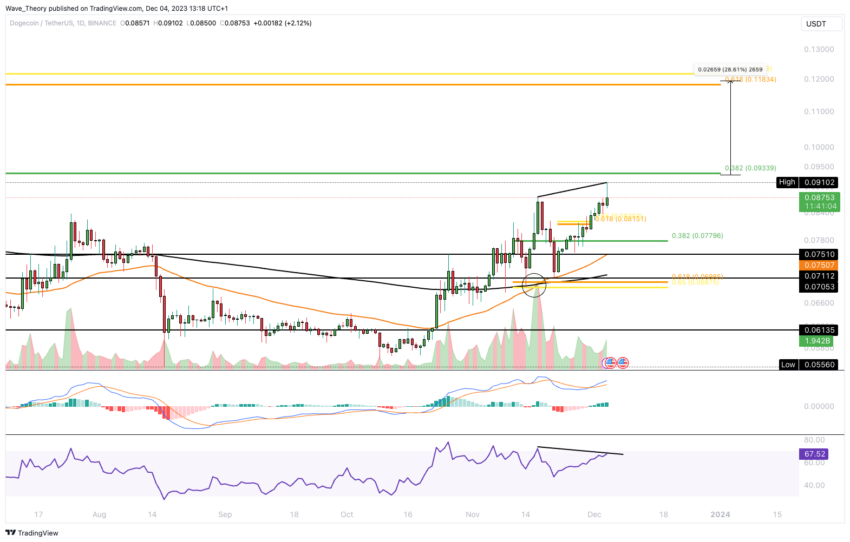
If a correction in DOGE’s price occurs, the next significant Fibonacci support levels are anticipated at around $0.078 and $0.07, respectively.
Over 60% of Dogecoin Addres
Go to Source to See Full Article
Author: Ryan James
Did you like this?
Tip BTC Newswire with Cryptocurrency
Donate Bitcoin to BTC Newswire
 Scan the QR code or copy the address below into your wallet to send some bitcoin:
Donate Bitcoin Cash to BTC Newswire
Scan the QR code or copy the address below into your wallet to send bitcoin:
Donate Ethereum to BTC Newswire
Scan the QR code or copy the address below into your wallet to send some Ether:
Donate Litecoin to BTC Newswire
Scan the QR code or copy the address below into your wallet to send some Litecoin:
Donate Monero to BTC Newswire
Scan the QR code or copy the address below into your wallet to send some Monero:
Donate ZCash to BTC Newswire
Scan the QR code or copy the address below into your wallet to send some ZCash:
Tip BTC Newswire with Cryptocurrency
Donate Bitcoin to BTC Newswire

Donate Bitcoin Cash to BTC Newswire

Donate Ethereum to BTC Newswire

Donate Litecoin to BTC Newswire

Donate Monero to BTC Newswire

Donate ZCash to BTC Newswire


