- Chainlink is testing the Bull Market Support Band, which could soon determine its trajectory.
- The ‘at the money’ percentage, around 8%, highlighted a transitional zone around $20.
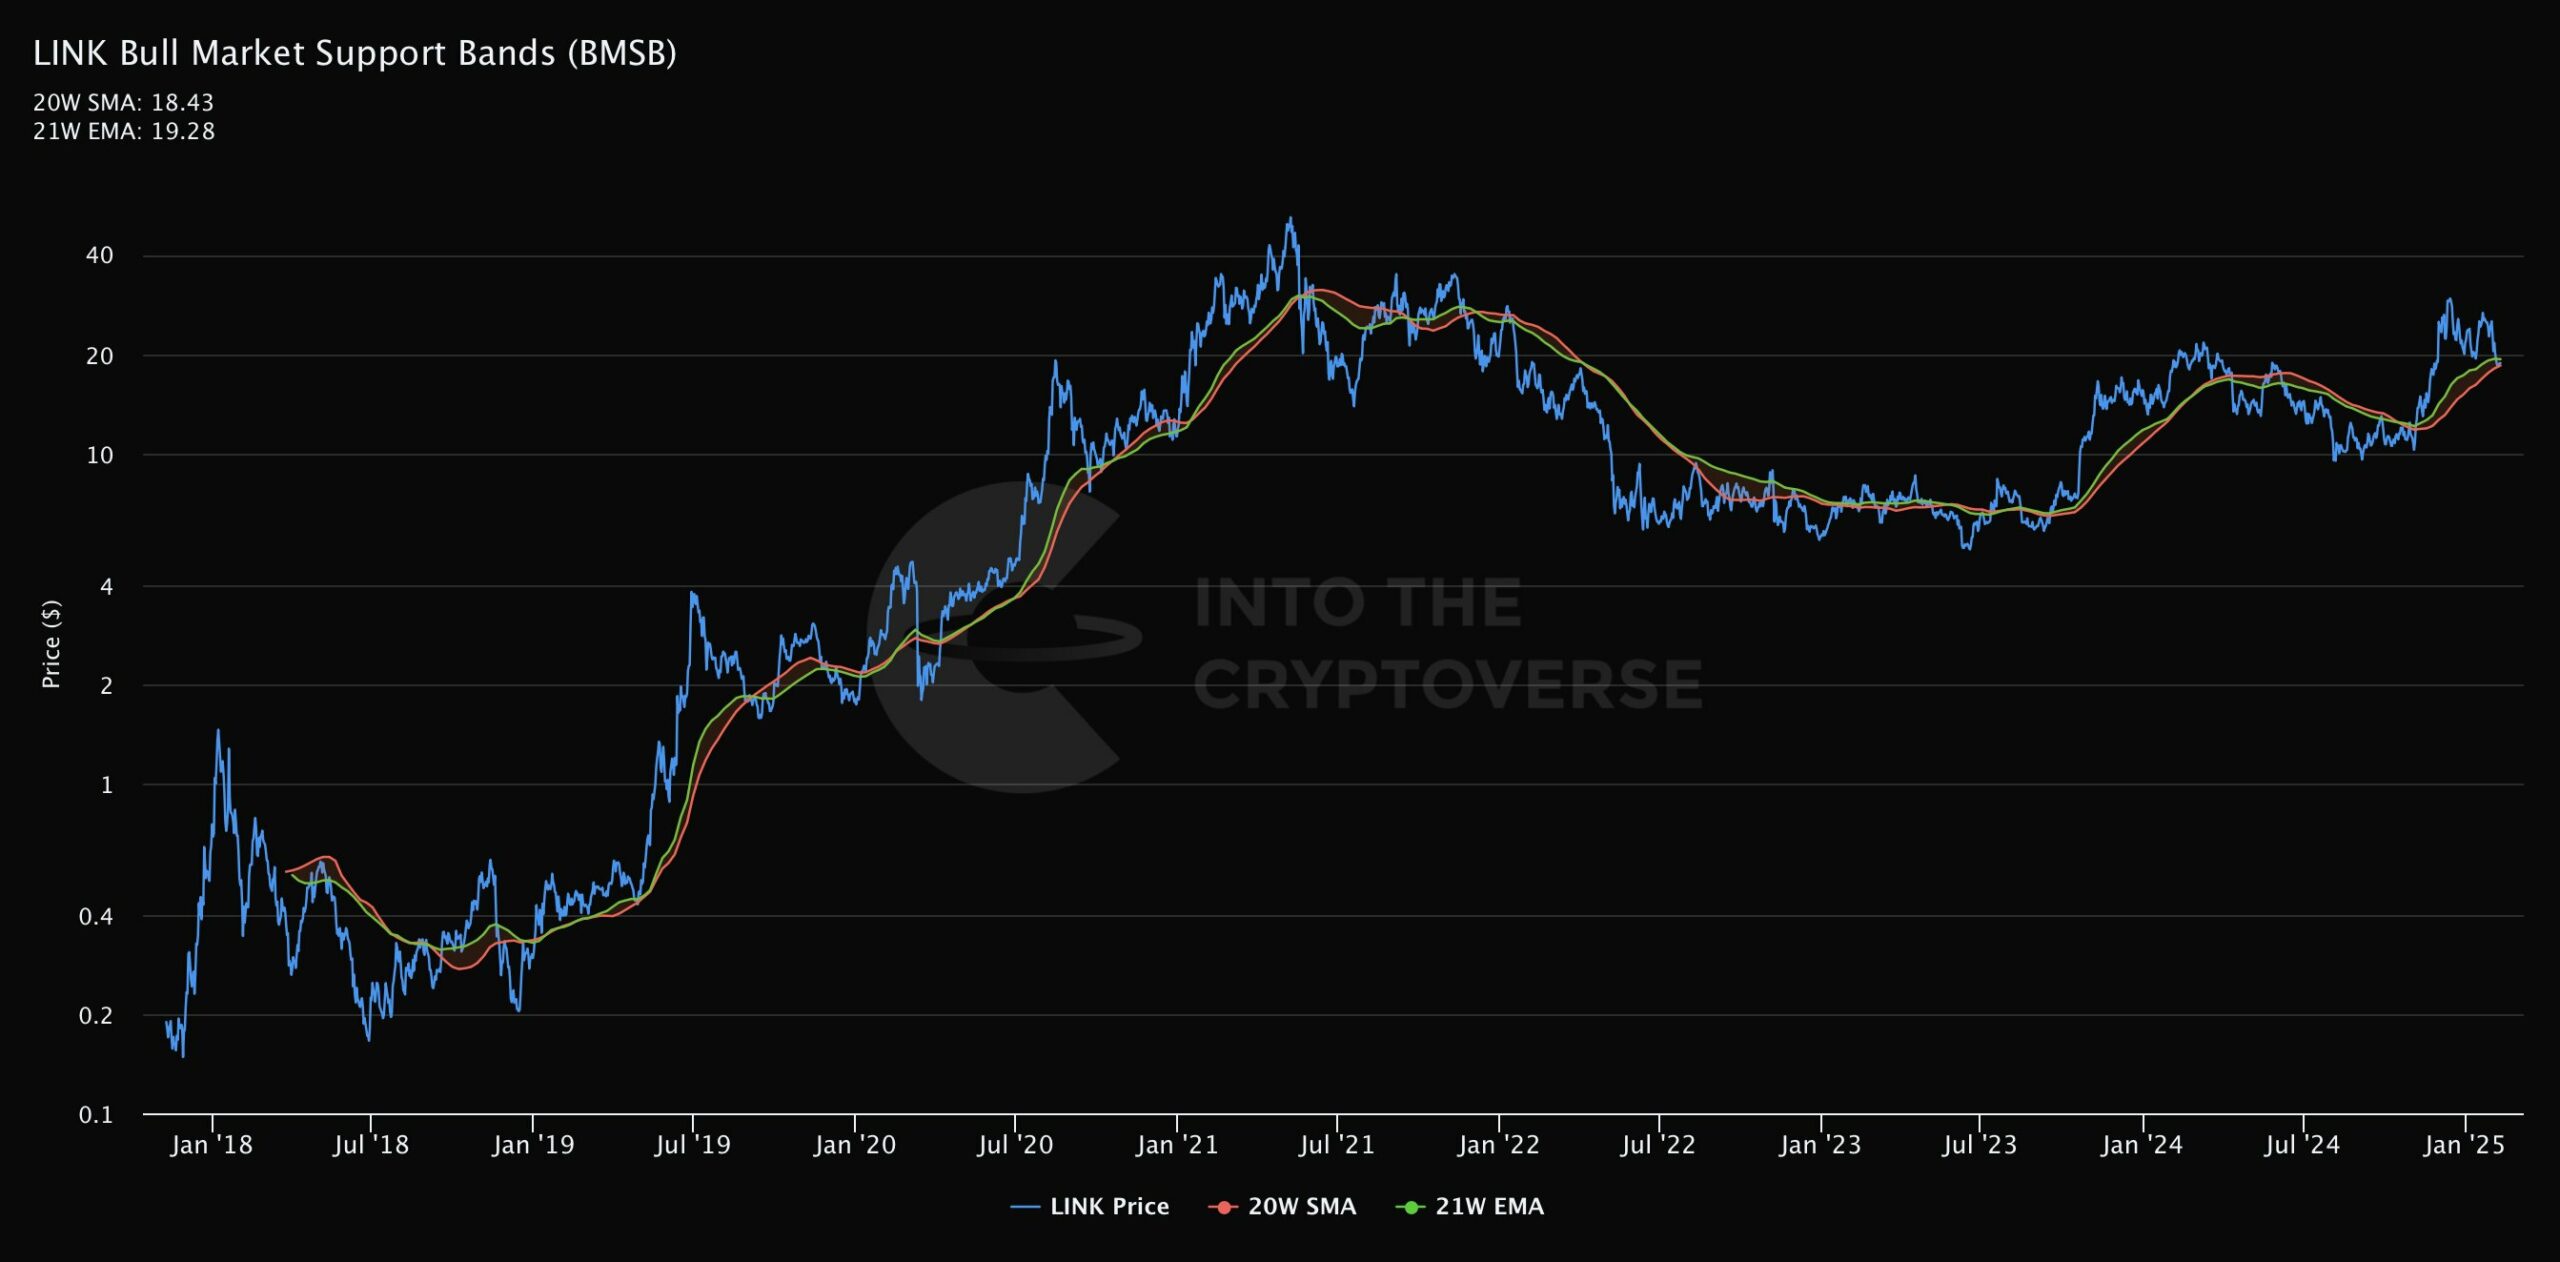
During press time, Chainlink [LINK] tested the Bull Market Support Band at $18 to determine the long-term trend strength.
Historically, holding above this level has signaled strong bullish momentum, allowing price continuation toward higher levels.
If LINK maintains support above this band, it could confirm its uptrend, attracting more buyers, with potential targets above $25 in the coming weeks.
A breakdown below this level, especially with a confirmed retest as resistance, could trigger selling pressure. This will invalidate Chainlink’s bullish structure and suggest further downside risk.
In such a scenario, LINK could retest lower supports near and below $14, which previously acted as accumulation zones.
Monitoring the weekly close around this level will be critical in confirming the next directional move for the altcoin.
LINK’s ‘long tail’ tests key level
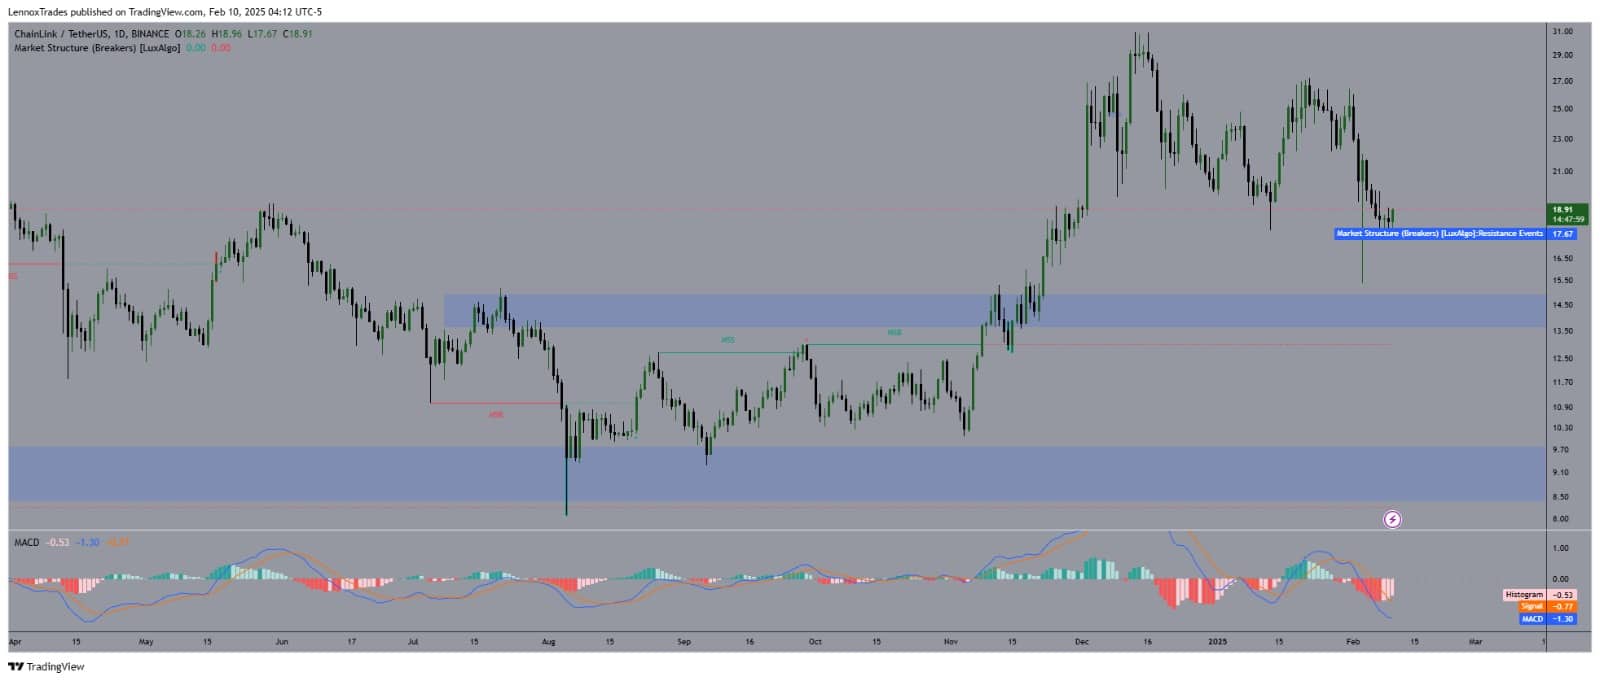
Analyzing LINK’s price action using the LuxAlgo structure break signaled a shift in momentum as Chainlink stays above $18, confirming a bullish bias.
This support was tested critically by the long tail on LINK’s daily chart and instantly rejected off it.
This suggests increasing buyer interest, with key resistance levels at $22 and $25. However, failure to hold $18 as support could lead to a trend reversal toward $16.80.
The MACD indicator showed rising bullish momentum, as the MACD line crossed above the signal line near $18, confirming upward momentum.
Go to Source to See Full Article
Author: Lennox Gitonga