Disclaimer: The information presented does not constitute financial, investment, trading, or other types of advice and is solely the writer’s opinion.
- The breakout past a long-term range meant buyers were firmly in control of the market.
- A pullback to a Fibonacci retracement level could offer an ideal buying opportunity for investors.
Chainlink [LINK] broke out of a range that had lasted for nearly eighteen months. This range extended from $5.55 in the south to $9.65 in the north. Technical analysis showed that, before the recent rally, the $8.15 region was a stiff resistance zone.
Read Chainlink’s [LINK] Price Prediction 2023-24
A recent report by AMBCrypto noted that bullish sentiment was strong behind LINK and underlined the $10 level as an important support level for buyers. Will we see a retest of this region soon, and should bulls enter the market at those prices?
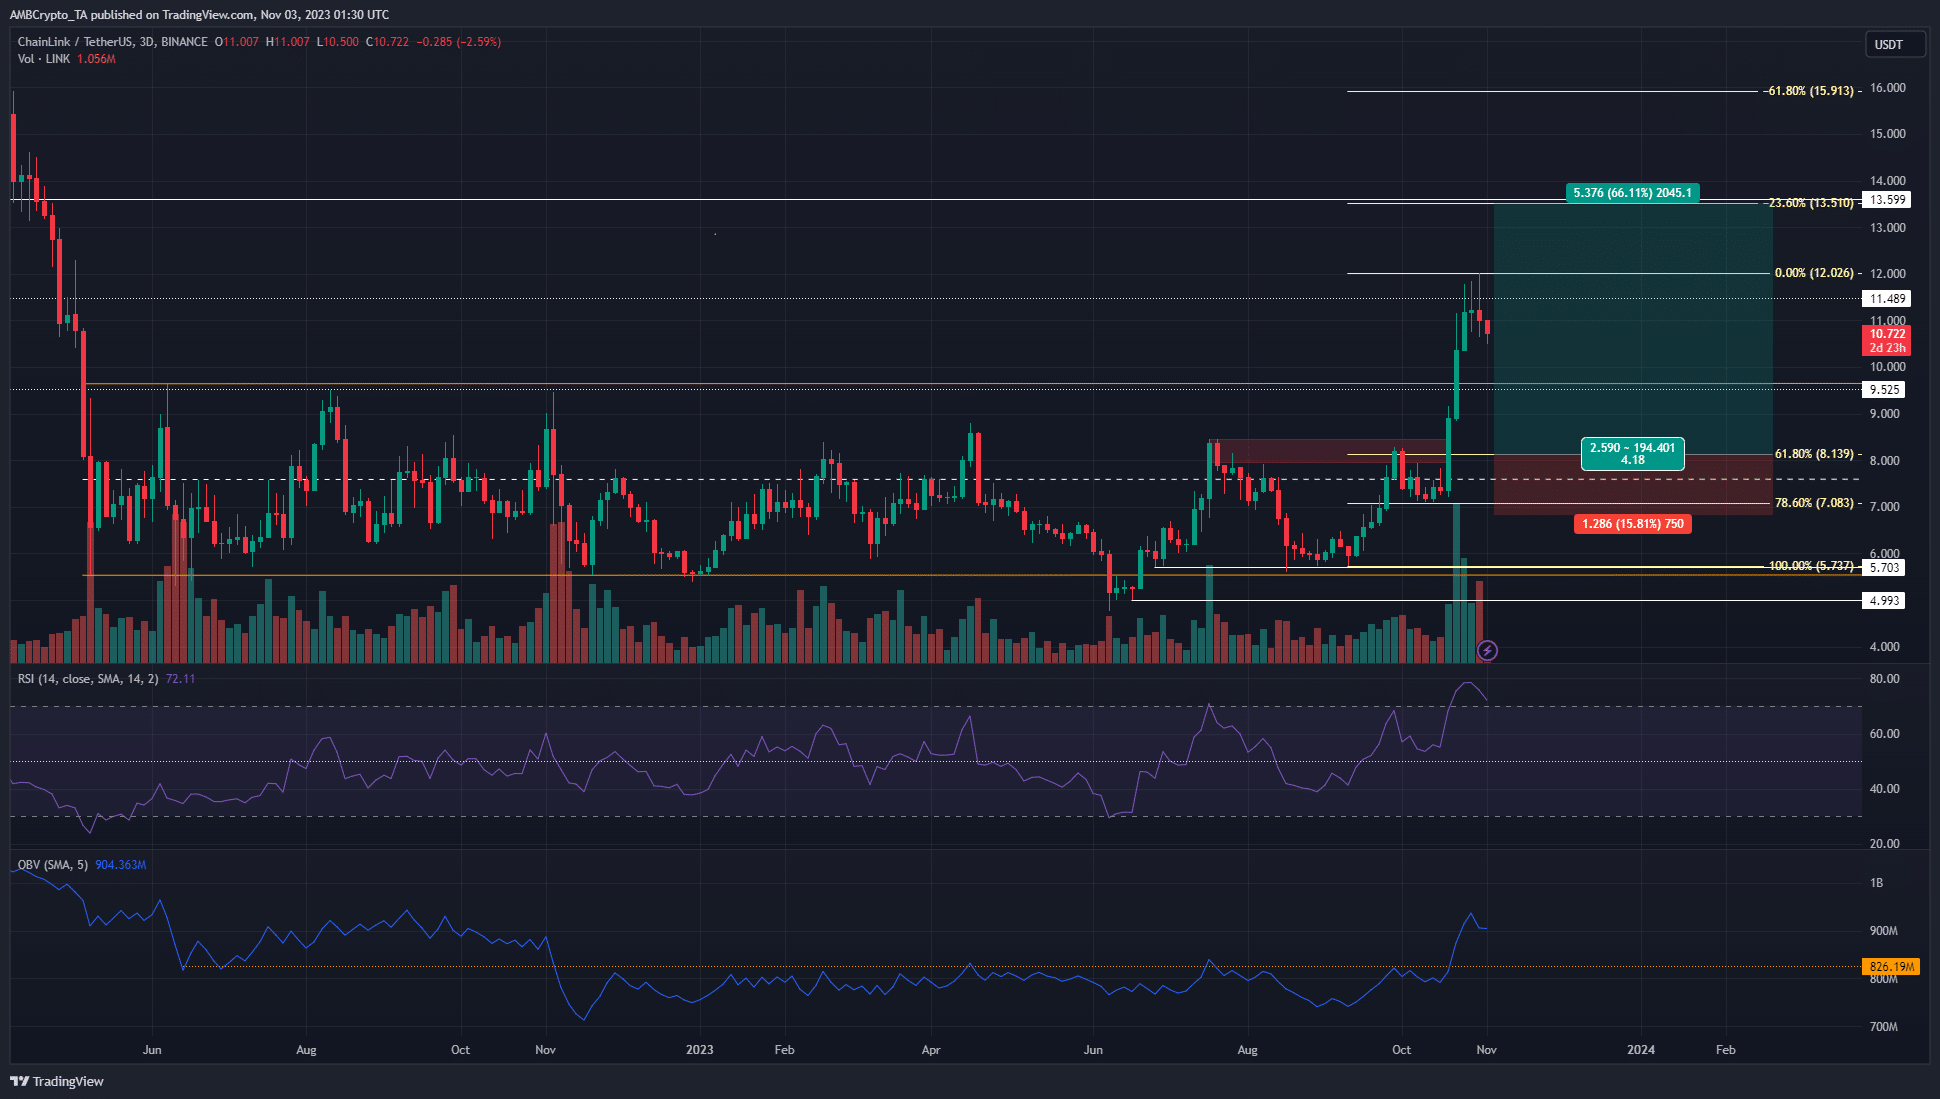
The confluence between Fibonacci and breaker block levels was noteworthy
The $8.15 region (red box) was a twelve-hour bearish order block that has been flipped to a bullish breaker by the recent price action. A set of Fibonacci retracement levels (pale yellow) were plotted based on the rally from $5.73 to $12.02 that began in September.
It showed the 61.8% level lay at $8.14, close to the bullish breaker block. Therefore, a retest of this region could offer a buying opportunity. A pullback to the range highs at $9.65, as well as the psychological support at $10, could also see the uptrend of LINK resume.
The breakout past an 18-month range was a sign of strong bullish conviction. The RSI and the On-Balance Volume (OBV) signaled bulls were in control. Hence, traders co
Go to Source to See Full Article
Author: Akashnath S
Tip BTC Newswire with Cryptocurrency
Donate Bitcoin to BTC Newswire

Donate Bitcoin Cash to BTC Newswire

Donate Ethereum to BTC Newswire

Donate Litecoin to BTC Newswire

Donate Monero to BTC Newswire

Donate ZCash to BTC Newswire


