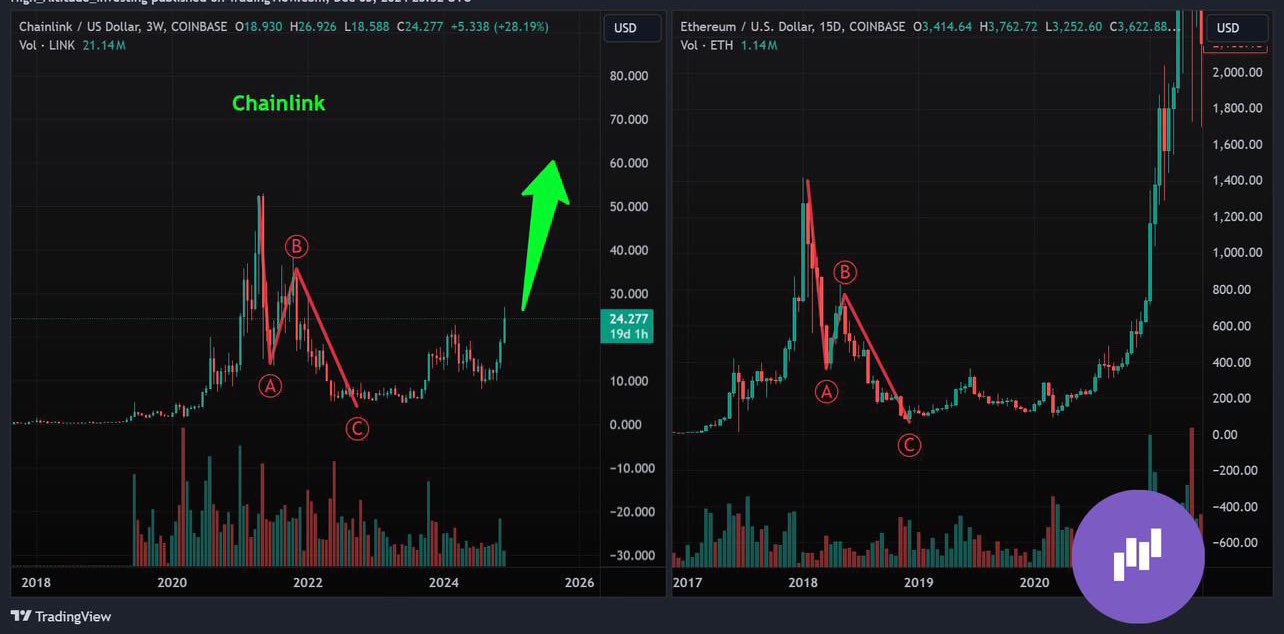
- Chainlink mirrored a historical pattern of Ethereum, suggesting a potential rally.
- Whales and institutions continue to accumulate LINK tokens.
Comparing Chainlink [LINK] and Ethereum [ETH] price actions showed a potential similarity in both the coins’ patterns.
LINK’s three peaks and troughs from 2018 to 2024, surged peaking around $52, followed by a sharp decline to B and a slower, steadier recovery phase to C.
This movement mirrored Ethereum’s price trajectory during a similar period, suggesting that LINK could mimic ETH’s past performance.
Ethereum, on the other hand, showed a more pronounced movement, soaring to new heights in its later stages, particularly noticeable in the strong uptrend after 2020, achieving a new peak at $4800.
Source: TradingView
If Chainlink continues to follow ETH’s historical performance, it could ascend toward the $90 mark. These could offer a bullish outlook for LINK, assuming current market conditions are sustained.
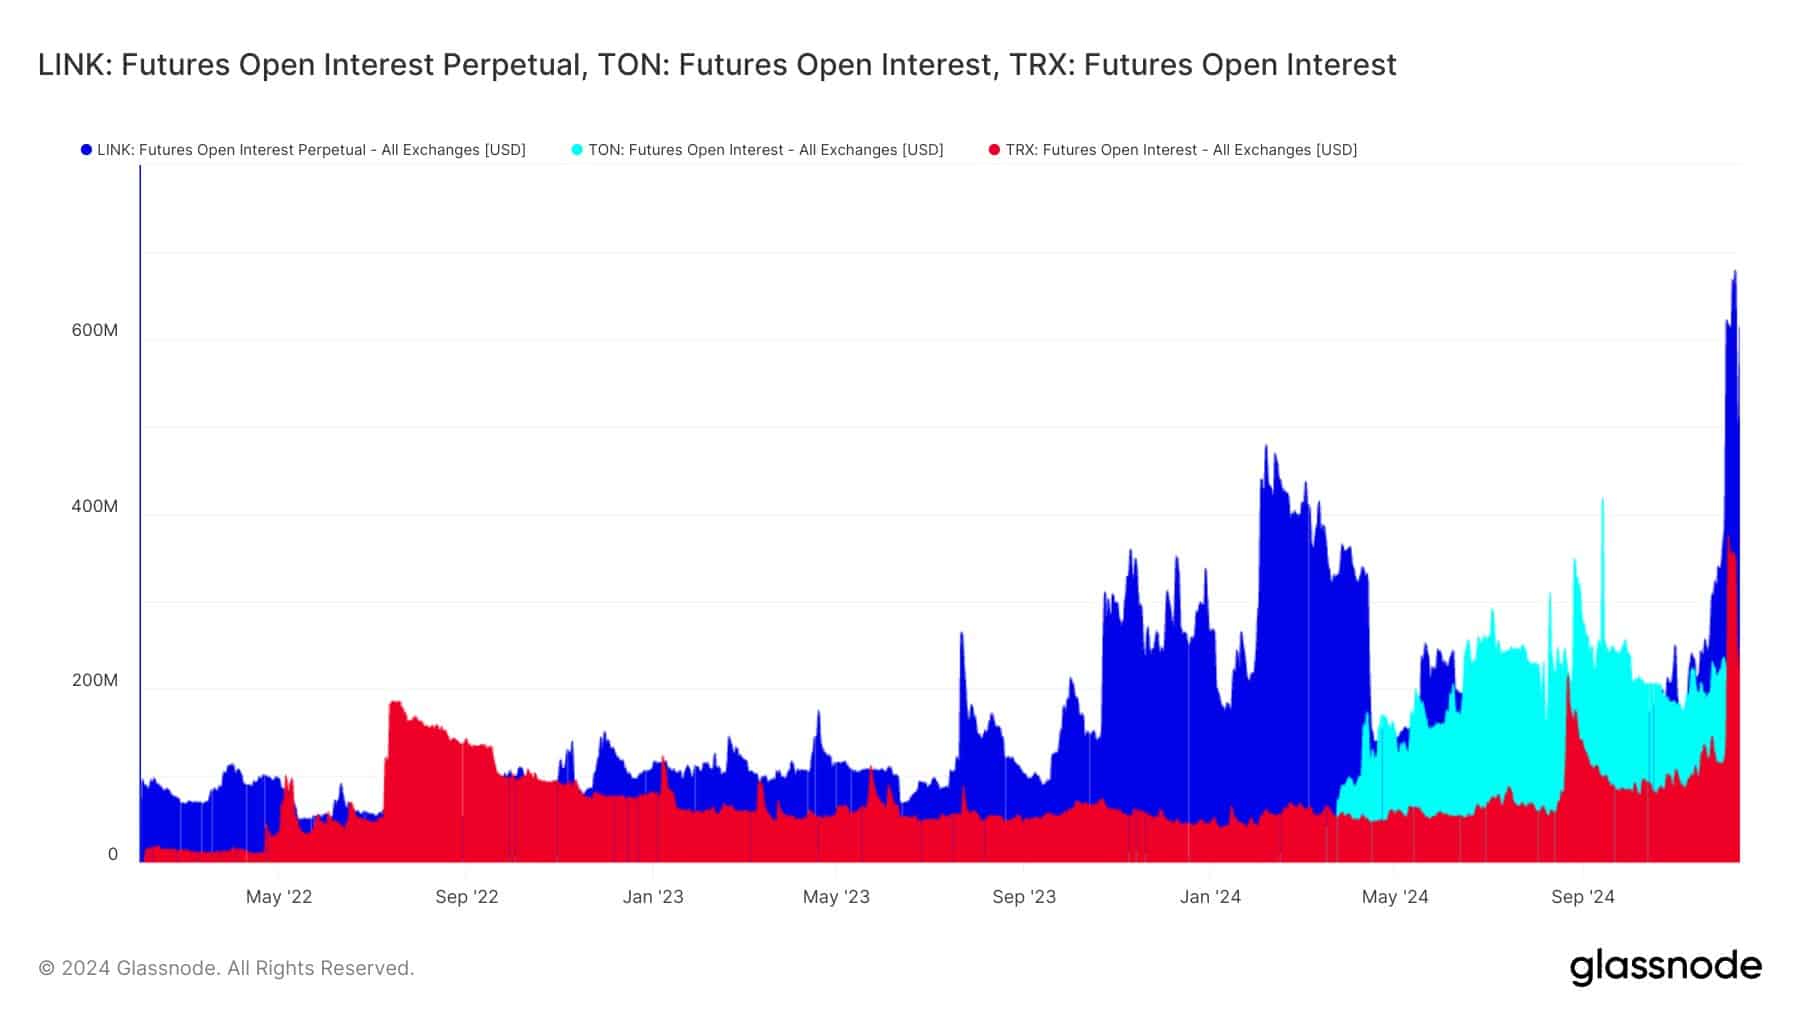
LINK’s Open Interest
Furthermore, LINK’s Futures Open Interest(OI) soared to a record $770.27 million, surpassing both Toncoin [TON] and Tron [TRX].
This surge in LINK’s OI, nearly three times that of TON and twice that of TRX, indicated growing trader confidence or speculative interest in its future price movements.
Historically, this period saw LINK achieving its highest price in nearly two years, highlighting renewed interest and possibly speculative optimism in its market potential.