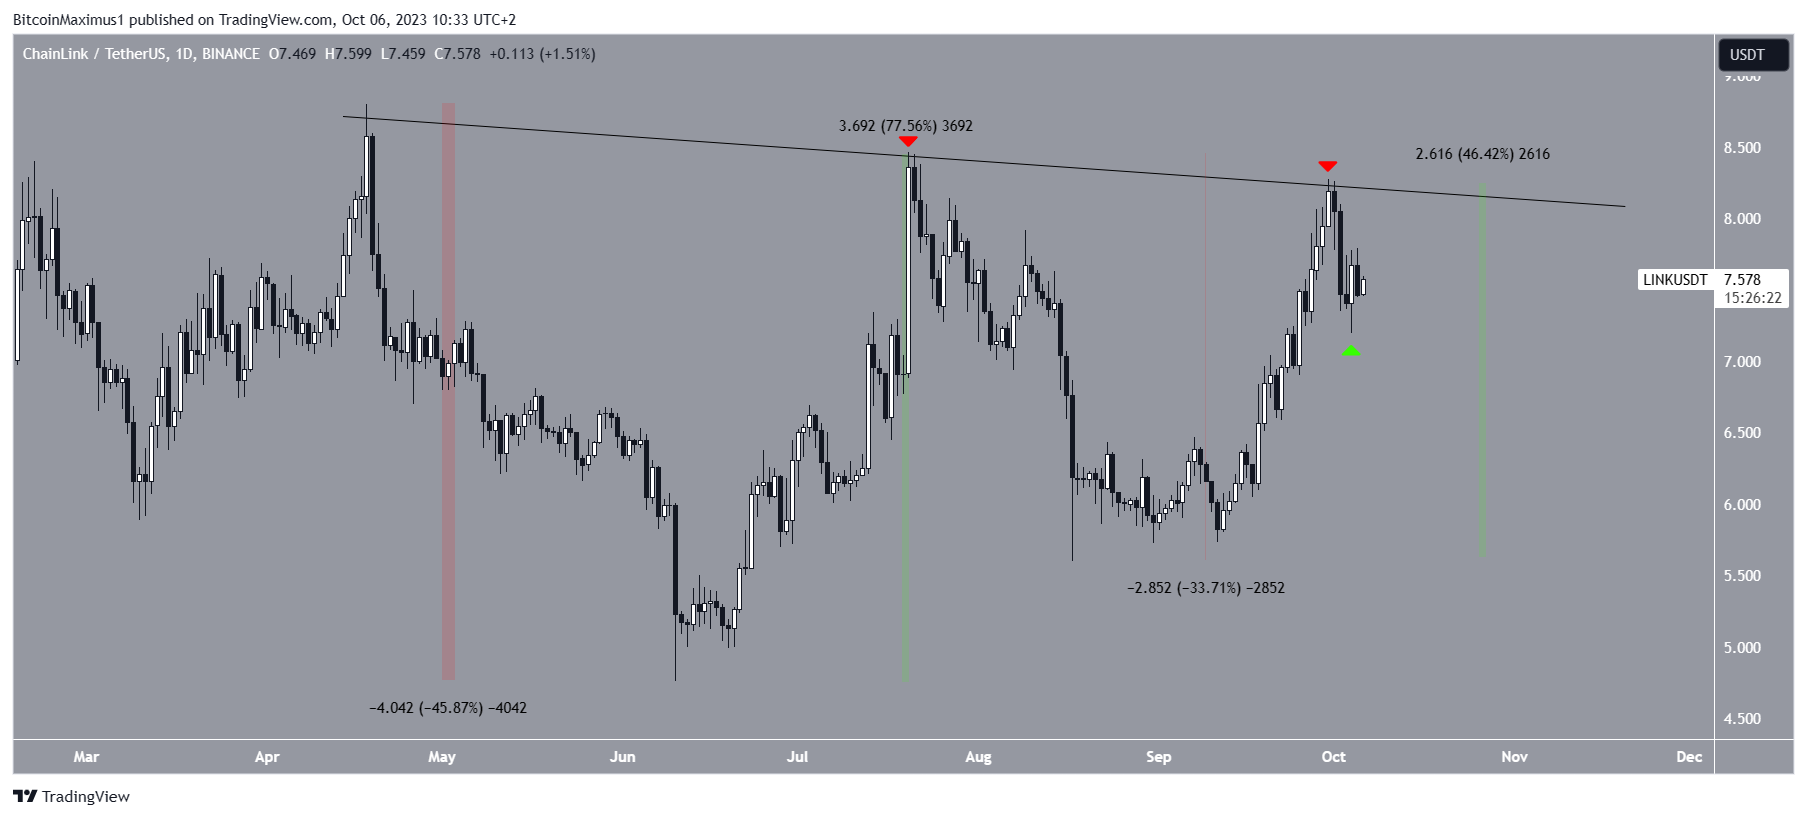
Since April, the Chainlink (LINK) price has fallen under a descending resistance trendline.
During this time, the Relative Strength Index movement has been especially prescient in determining the Chainlink price volatility.
Will Chainlink Reach New Yearly High?
The daily timeframe technical analysis shows that the LINK price has experienced significant volatility since April.
During this time, it has seen drops of 46% and 33% (red) and increases of 77% and 46%, respectively.
LINK has also fallen under a descending resistance trendline throughout this period. The trendline caused two rejections on July 20 and September 30, respectively (red icons).
The first rejection catalyzed a 33% decrease, while the second one only led to a slight retracement.

Go to Source to See Full Article
Author: Valdrin Tahiri


