
The Chainlink (LINK) price shows bearish long-term signs, the daily time frame readings suggest that an upward bounce could occur before the final capitulation.
The indicator readings and the daily time frame price action support the increase, while the weekly time frame suggests that the long-term trend is bearish.
Chainlink Price Falls After Rejection
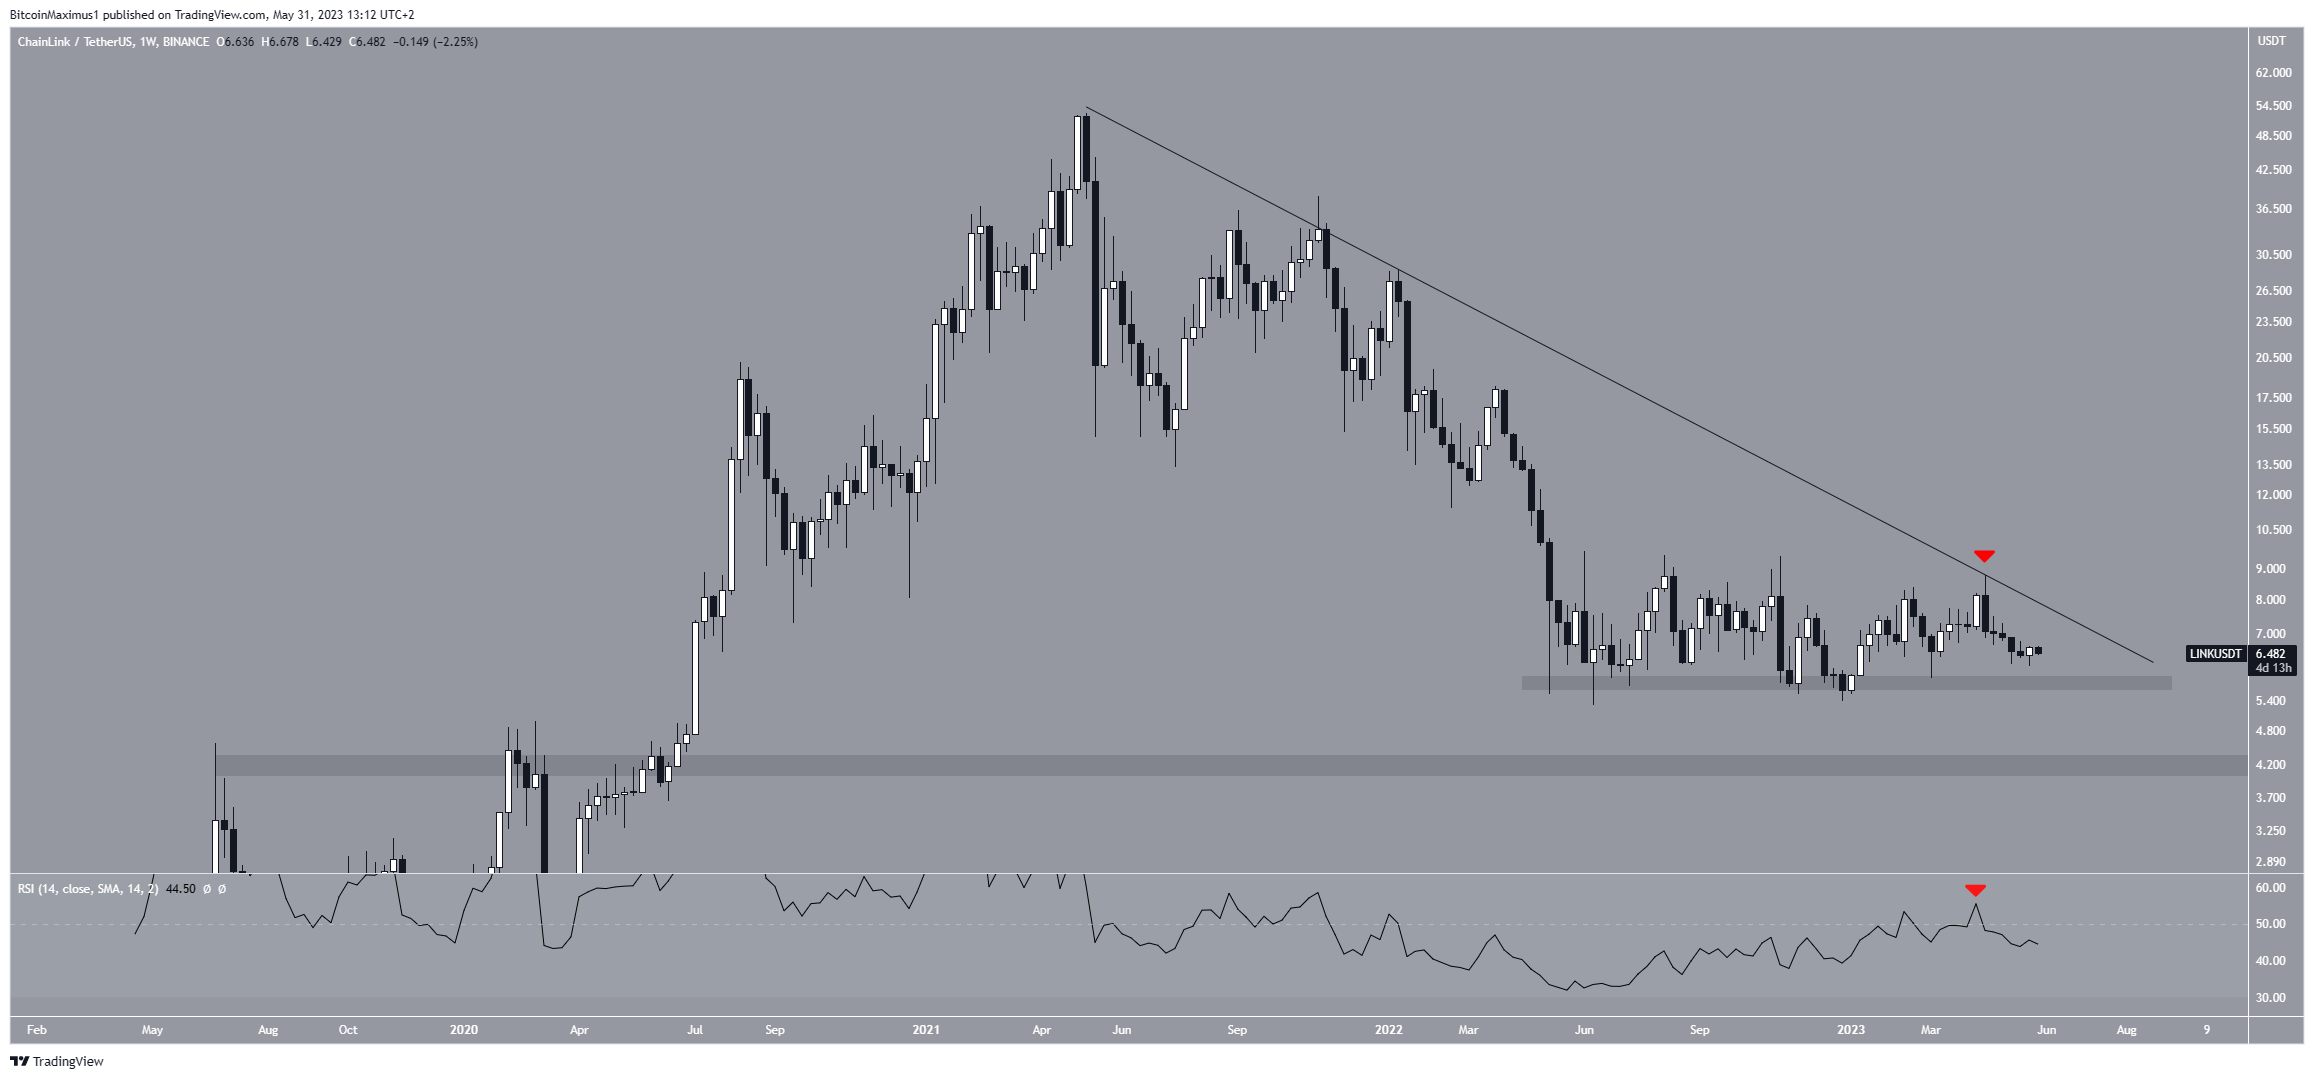
The weekly time frame outlook shows that the LINK price has decreased under a descending resistance line since May 2021. At the time, the price had just reached a new all-time high of $53.
The decrease led to a low of $5.30 in June 2022. While the price has bounced several times since then, it has traded very close to the $5.60 horizontal support area.
Learn more about Chainlink:
At the end of April, LINK was rejected by the descending resistance line (red icon), catalyzing the current downward movement.
Go to Source to See Full Article
Author: Valdrin Tahiri
Tip BTC Newswire with Cryptocurrency
Donate Bitcoin to BTC Newswire

Donate Bitcoin Cash to BTC Newswire

Donate Ethereum to BTC Newswire

Donate Litecoin to BTC Newswire

Donate Monero to BTC Newswire

Donate ZCash to BTC Newswire


