
The Chainlink (LINK) price shows bullish signs in the weekly and daily time frame. It is approaching a key long-term resistance level.
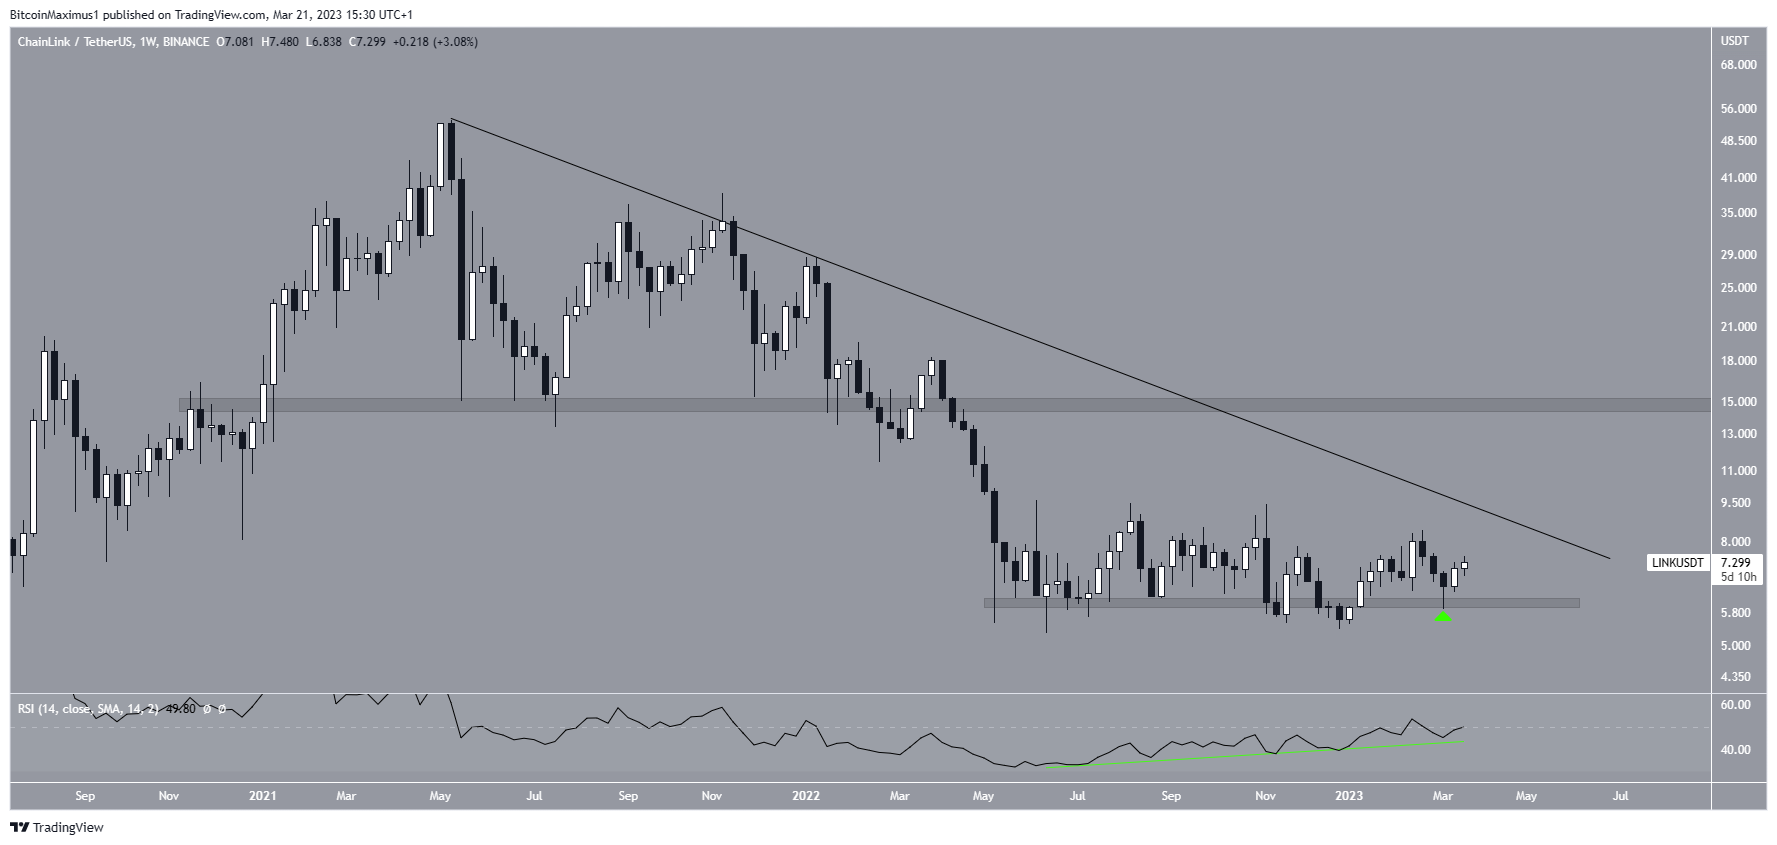
LINK is the native token of Chainlink, which uses a decentralized oracle network to allow blockchain networks to interact with external data feeds. It was created by Sergey Nazarov. The Chainlink price has fallen under a descending resistance line since reaching an all-time high price of $53 in May 2021.
The decrease culminated in a low of $5.30 in June 2022. Since then, the price has traded very close to the $6.10 horizontal support area. More recently, the LINK price created a long lower wick and a lower high (green icon), which can be considered the first step in a bullish structure.
Moreover, the weekly RSI has generated bullish divergence for the entire period. The indicator has now almost moved above 50.
If the increase continues, the resistance line at $8 is expected to provide resistance. A breakout from the line could take the price to the $14.90 resistance area.
Chainlink (LINK) Deviation and Reclaim Increase Bullish Sentiment
The technical analysis from the daily time frame provides a more bullish outlook. The price has increased since March 10 and broke out from a descending resistance line four days l
Go to Source to See Full Article
Author: Valdrin Tahiri
Tip BTC Newswire with Cryptocurrency
Donate Bitcoin to BTC Newswire

Donate Bitcoin Cash to BTC Newswire

Donate Ethereum to BTC Newswire

Donate Litecoin to BTC Newswire

Donate Monero to BTC Newswire

Donate ZCash to BTC Newswire


