- Analysis reveals that TIA has formed an inverse head-and-shoulders pattern, a signal that an asset is gearing up for gains.
- However, the anticipated rally has been delayed, with technical indicators hinting at a potential minor pullback.
Over the past month, Celestia [TIA] has seen bearish momentum, with its price falling by 6.54% to $5.93. Yet, despite this downward pressure, bullish signs are emerging, suggesting a possible trend reversal on the horizon.
Still, TIA dipped by an additional 3.15% at press time in the last 24 hours, and may face further declines before a solid rally takes shape.
Bullish inverse head-and-shoulders pattern sets TIA for potential upside
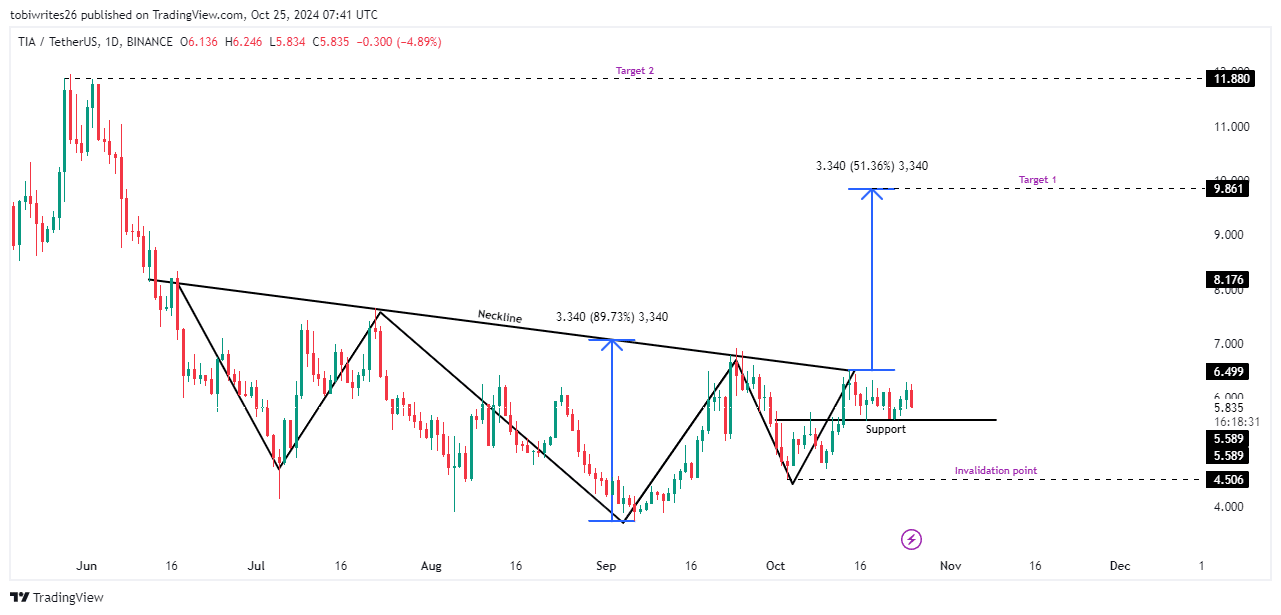
An inverse head-and-shoulders pattern—a bullish indicator that often precedes a significant rally—has surfaced for TIA. This formation typically signals a move upward, with the target based on the distance between the neckline and the pattern’s peak.
For TIA, this could translate to a projected 51.36% gain, bringing its price to a target of $9.861. Continued momentum might then propel TIA further, with a secondary target of $11.880.
Currently, TIA’s price is declining and may find support at $5.589, a level that could prompt a rebound and continuation to the upside. However, if TIA falls below $4.506, it would invalidate the bullish inverse head-and-shoulders pattern.
Source: Trading View
Celestia sees corrective move causing a downtick
TIA’s rally has been delayed, as it has yet to rise above the neckline—an important level to indicate a potential rally.
AMBCrypto’s analysis, using key technical indicators, suggests that while a minor downturn may persist, TIA’s overall structure remains bullish
Go to Source to See Full Article
Author: Olayiwola Dolapo