
The Celestia (TIA) price has increased swiftly since January 3, reaching a new all-time high price of $20.18 today.
TIA trades at the resistance trend line of a long-term pattern. Will it break out or get rejected?
TIA Reaches Channel’s Resistance
The technical analysis of the daily time frame shows that TIA has increased alongside an ascending parallel channel since November. More recently, it bounced at the support trend line twice (green icons) on January 3 and 8, respectively.
The TIA price has accelerated since, reaching a new all-time high of $2.18 today. The high was made at the channel’s resistance trend line. However, TIA fell slightly after reaching the high.
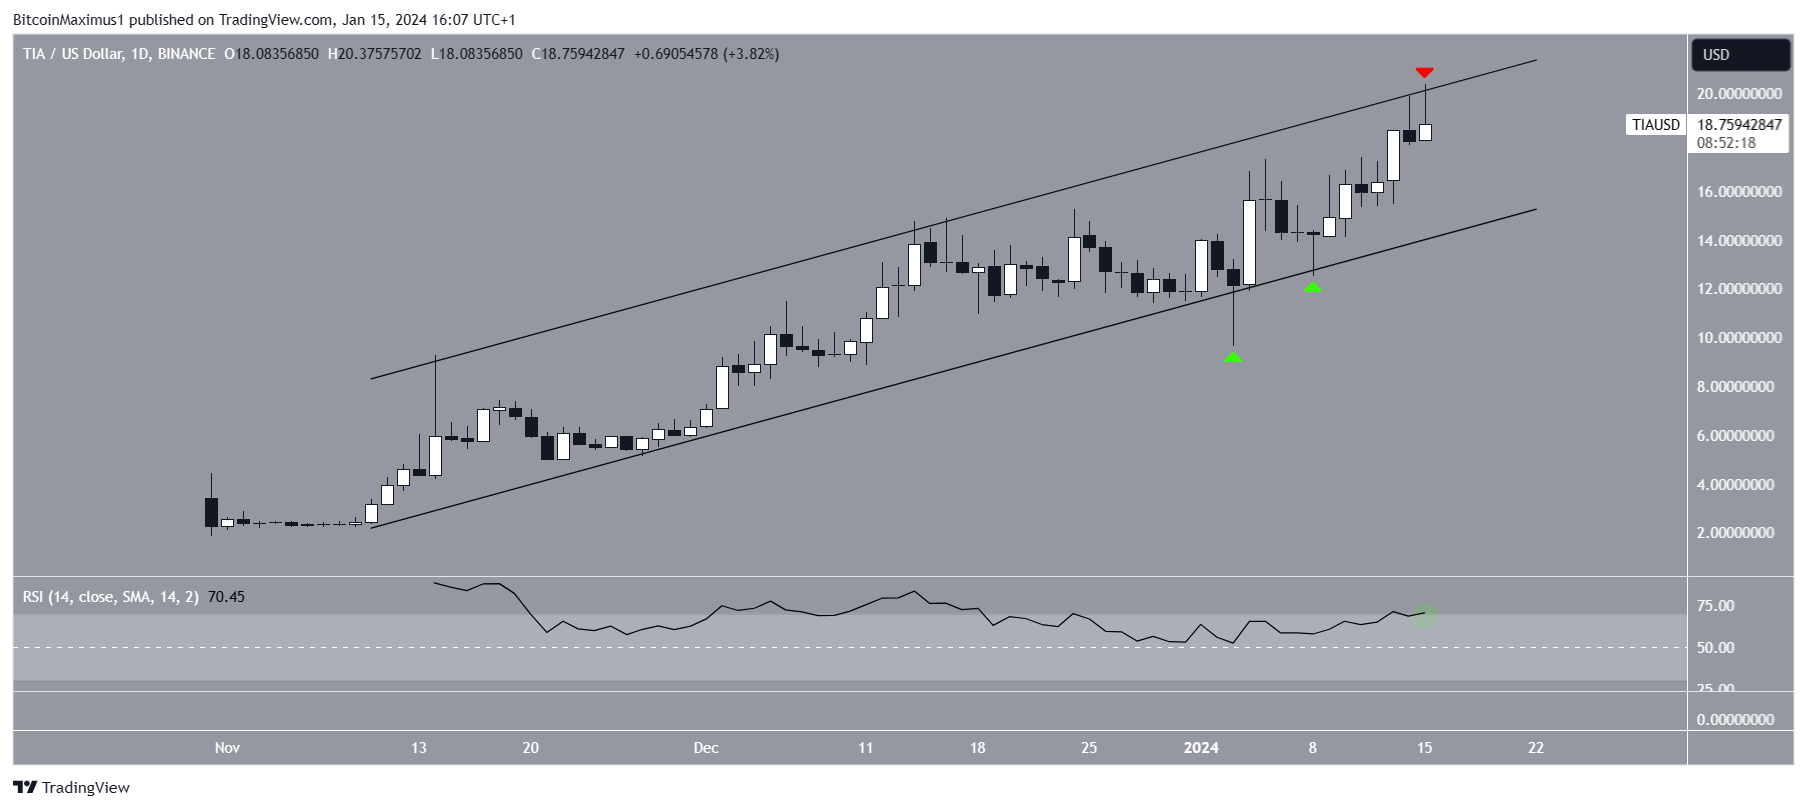
The RSI is a momentum indicator traders use to evaluate whether a market is overbought or oversold and whether to accumulate or sell an ass
Go to Source to See Full Article
Author: Valdrin Tahiri
Tip BTC Newswire with Cryptocurrency
Donate Bitcoin to BTC Newswire

Donate Bitcoin Cash to BTC Newswire

Donate Ethereum to BTC Newswire

Donate Litecoin to BTC Newswire

Donate Monero to BTC Newswire

Donate ZCash to BTC Newswire


