The Cardano price is up 2.9% in the past 24 hours, showing surprising strength while most top altcoins remain flat. But on the 7-day chart, ADA is still down over 12%.
ADA’s short-term chart shows a strong bullish pattern with upside potential. But if we zoom out or check on-chain data, there’s a visible weakness forming beneath the surface. A bullish pattern alone isn’t enough—especially when key support metrics are vanishing. Cardano may be holding structure, but it’s losing critical ground.
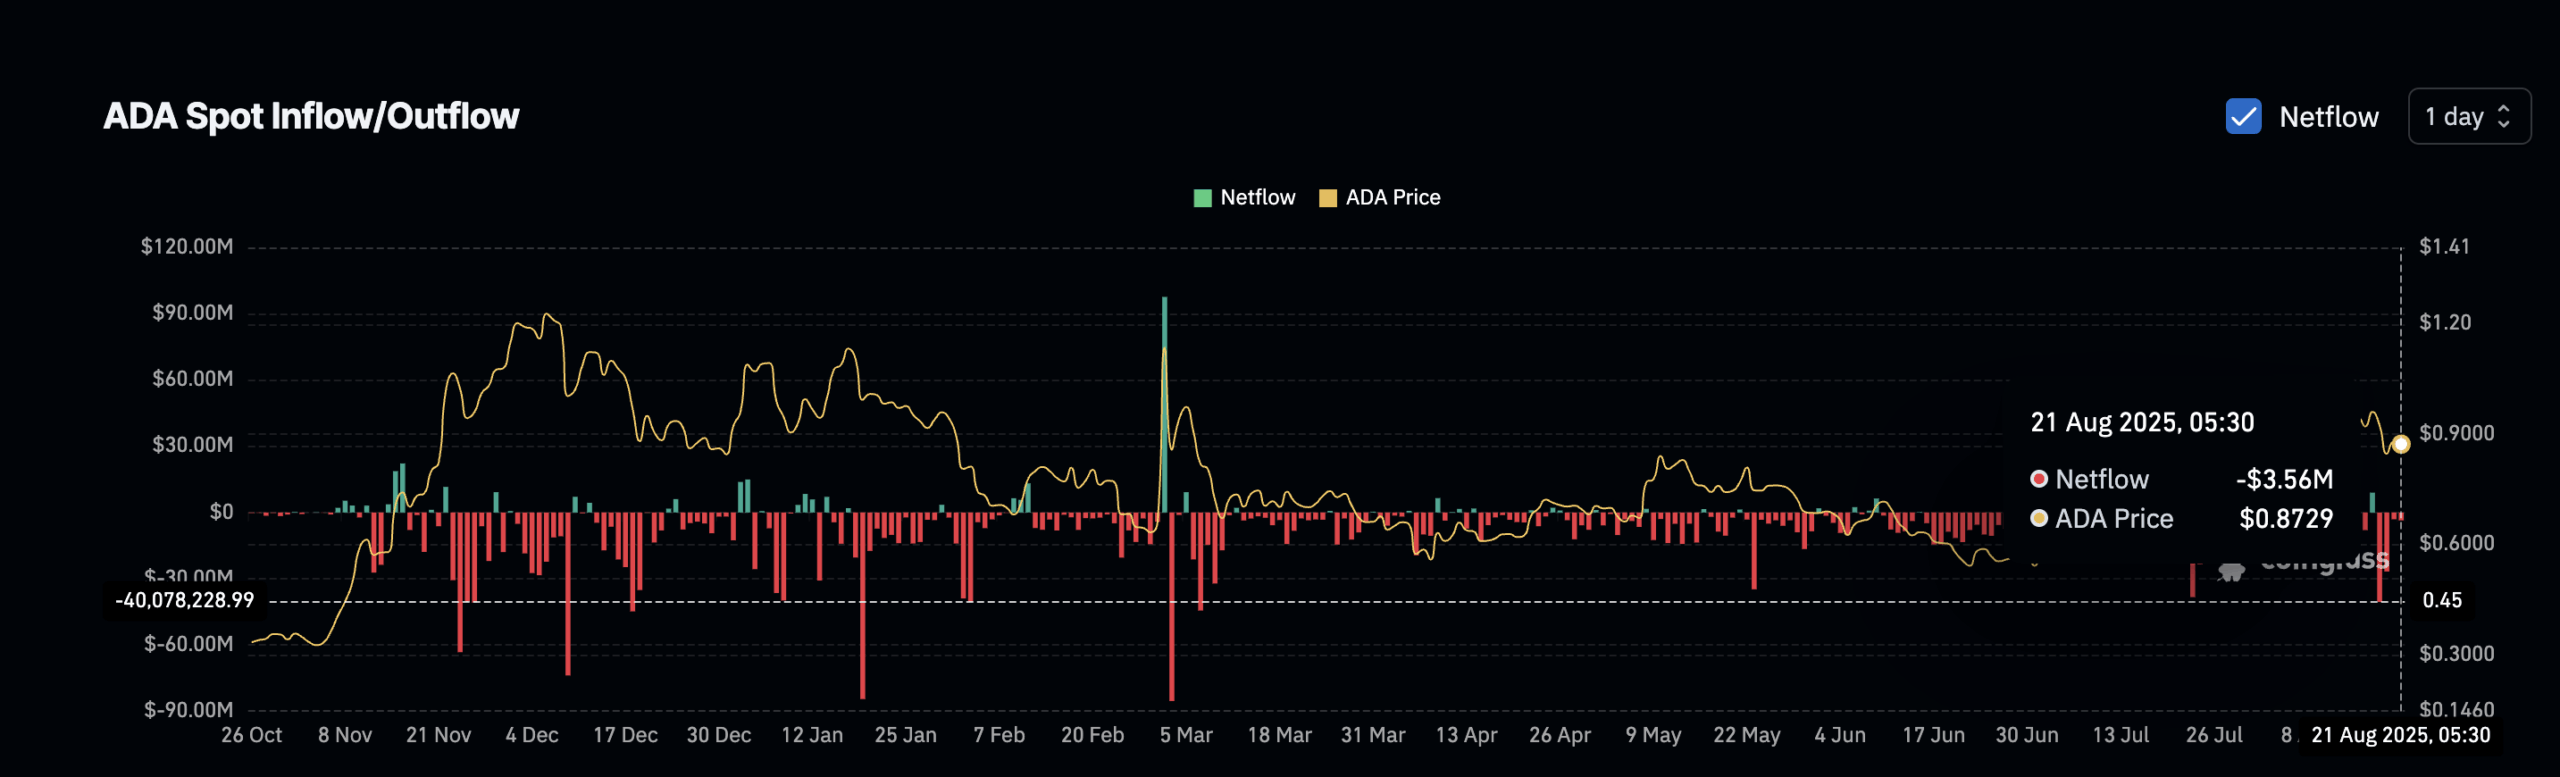
Cardano’s 90% Drop in Outflow Hints at Buyer Weakness
Over the past few days, net outflows from ADA spot exchanges have slowed drastically. At its local peak, Cardano recorded $40.07 million in daily outflows: a clear sign of strong buying conviction, as traders were pulling coins off exchanges.
That conviction has faded. By August 21, ADA’s net outflow dropped to just $3.56 million. That’s a 91% decline from peak demand. While this still represents net outflow, the plunge in size suggests buyers are stepping aside. There’s still no aggressive inflow, but momentum has stalled.
For token TA and market updates: Want more token insights like this? Sign up for Editor Harsh Notariya’s Daily Crypto Newsletter here.
Too Many Longs? Leverage Stack Could Add Fuel to the Fire
Liquidation map data shows ADA’s long positions are stacked dangerously tight. On Bitget, over $174.80 million in long leverage is built up, compared to just $73.56 million in shorts.
The biggest leveraged cluster sits near $0.83 to $0.85, meaning if the Cardano price drops to that range, liquidations could snowball. Even though too many Long positions signify positive bias but an imbalance as this can lead to a long squeeze.
Go to Source to See Full Article
Author: Ananda Banerjee
