Since early June, Cardano has traded within a narrow range, facing strong resistance around $0.59 while finding consistent support near $0.55.
However, a historical pattern similar to ADA’s previous market cycles is beginning to unfold, indicating that the altcoin may be in the final stages of a pullback before witnessing a bullish reversal.
ADA Enters Final Accumulation Phase
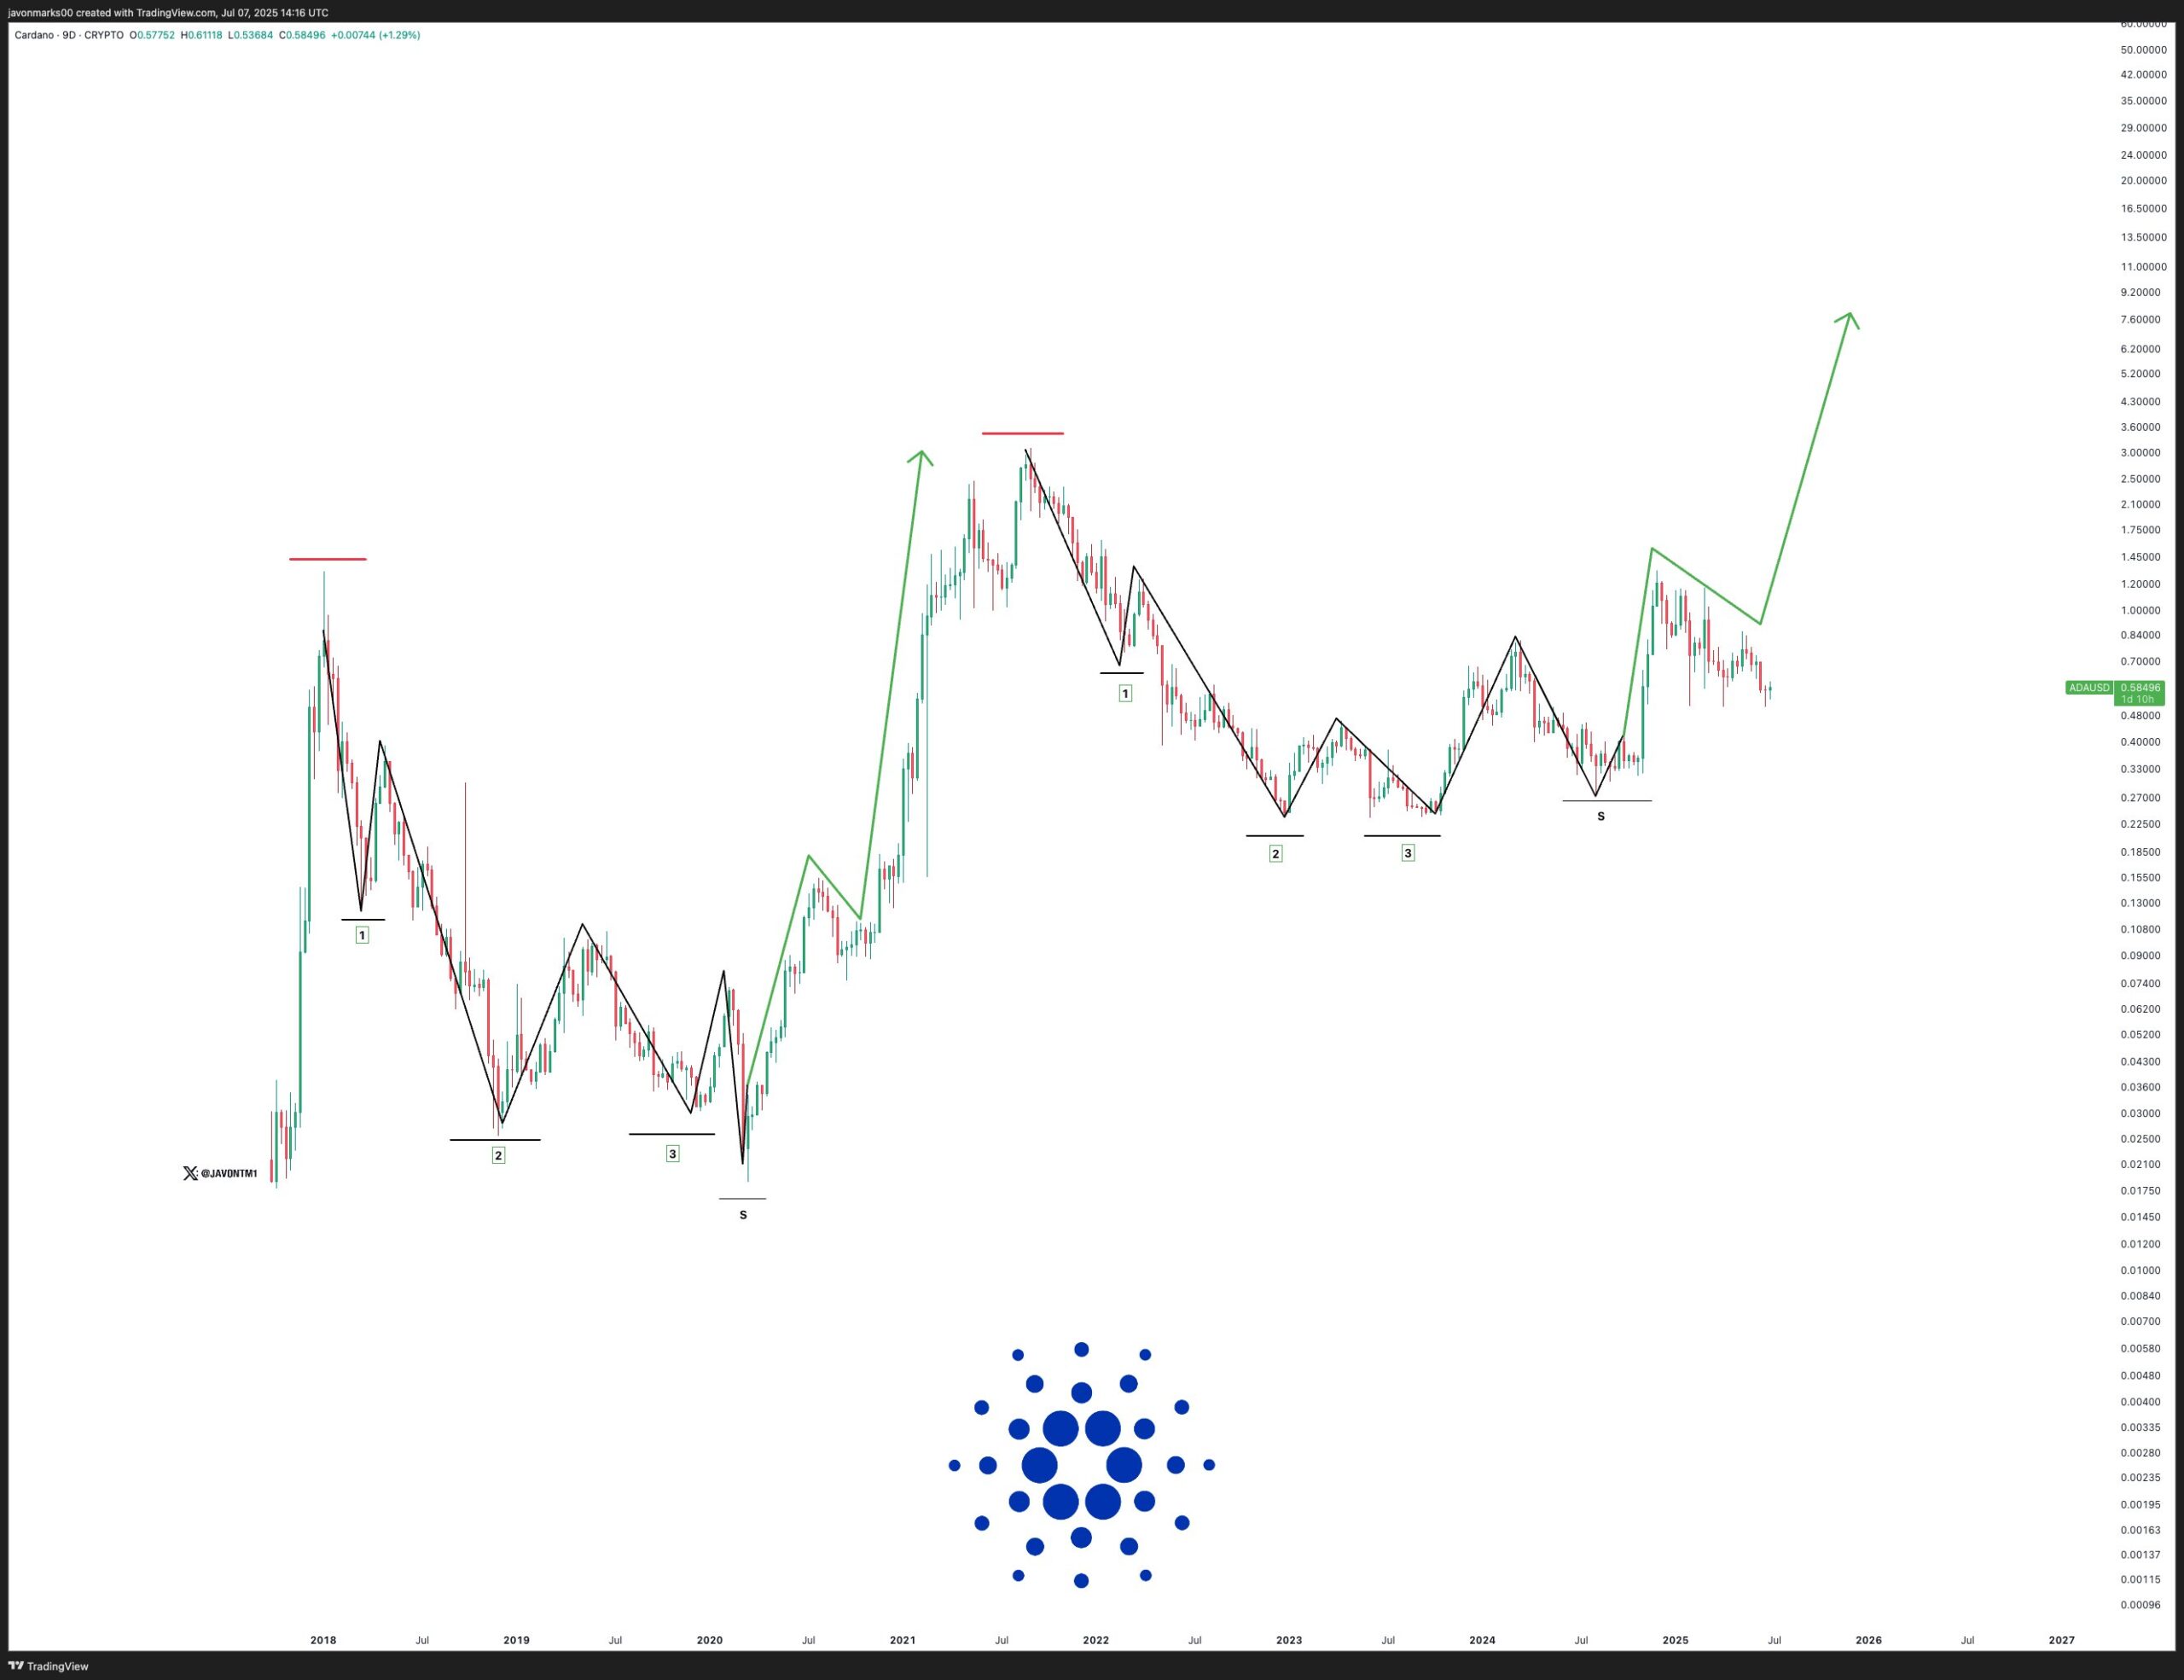
In a July 7 post on X, crypto analyst Javon Marks noted that ADA’s price movements now mirror the structure of its last major accumulation phase, which preceded its explosive 2021 rally.
In the price chart Marks added to the post, he drew parallels between ADA’s past and present market cycles and found that between 2018 and 2020, the coin went through a three-wave correction and formed a rounded bottom, which ultimately led to its explosive breakout past $3.09 in 2021.
Since 2022, a similar structure has been gradually unfolding, with ADA once again completing a multi-wave correction and forming a price base. This repetition suggests the coin may be gearing up for another major rally if the pattern holds.
Such fractal patterns are often seen in long-term market cycles, where investor behavior and market psychology play out in repeated phases. If ADA continues to mirror its historical structure, a breakout from the current accumulation zone could pave the way for a bullish phase, driving prices toward previous highs and beyond.
According to Marks, if the pattern holds, “this can result in a more than 383% upside from here…”
ADA Traders Bet on Breakout
While Marks’ projections represent more of a long-term outlook, the near-term prospects—despite recent pullbacks—do not look
Go to Source to See Full Article
Author: Abiodun Oladokun
