
The Cardano (ADA) price is at risk of breaking down from a long-term ascending support line, something that could trigger a sharp fall.
The price action and indicator readings from different timeframes support the ongoing descent, increasing the likelihood that a breakdown will eventually occur.
Cardano Price Drops After Deviation
The weekly time frame technical analysis for ADA provides a bearish outlook. The main reason for this is the deviation above the long-term $0.40 resistance area and the subsequent decrease below it.
This is a bearish sign since it means that the breakout was illegitimate. Rather, sellers took over and pushed the price down.
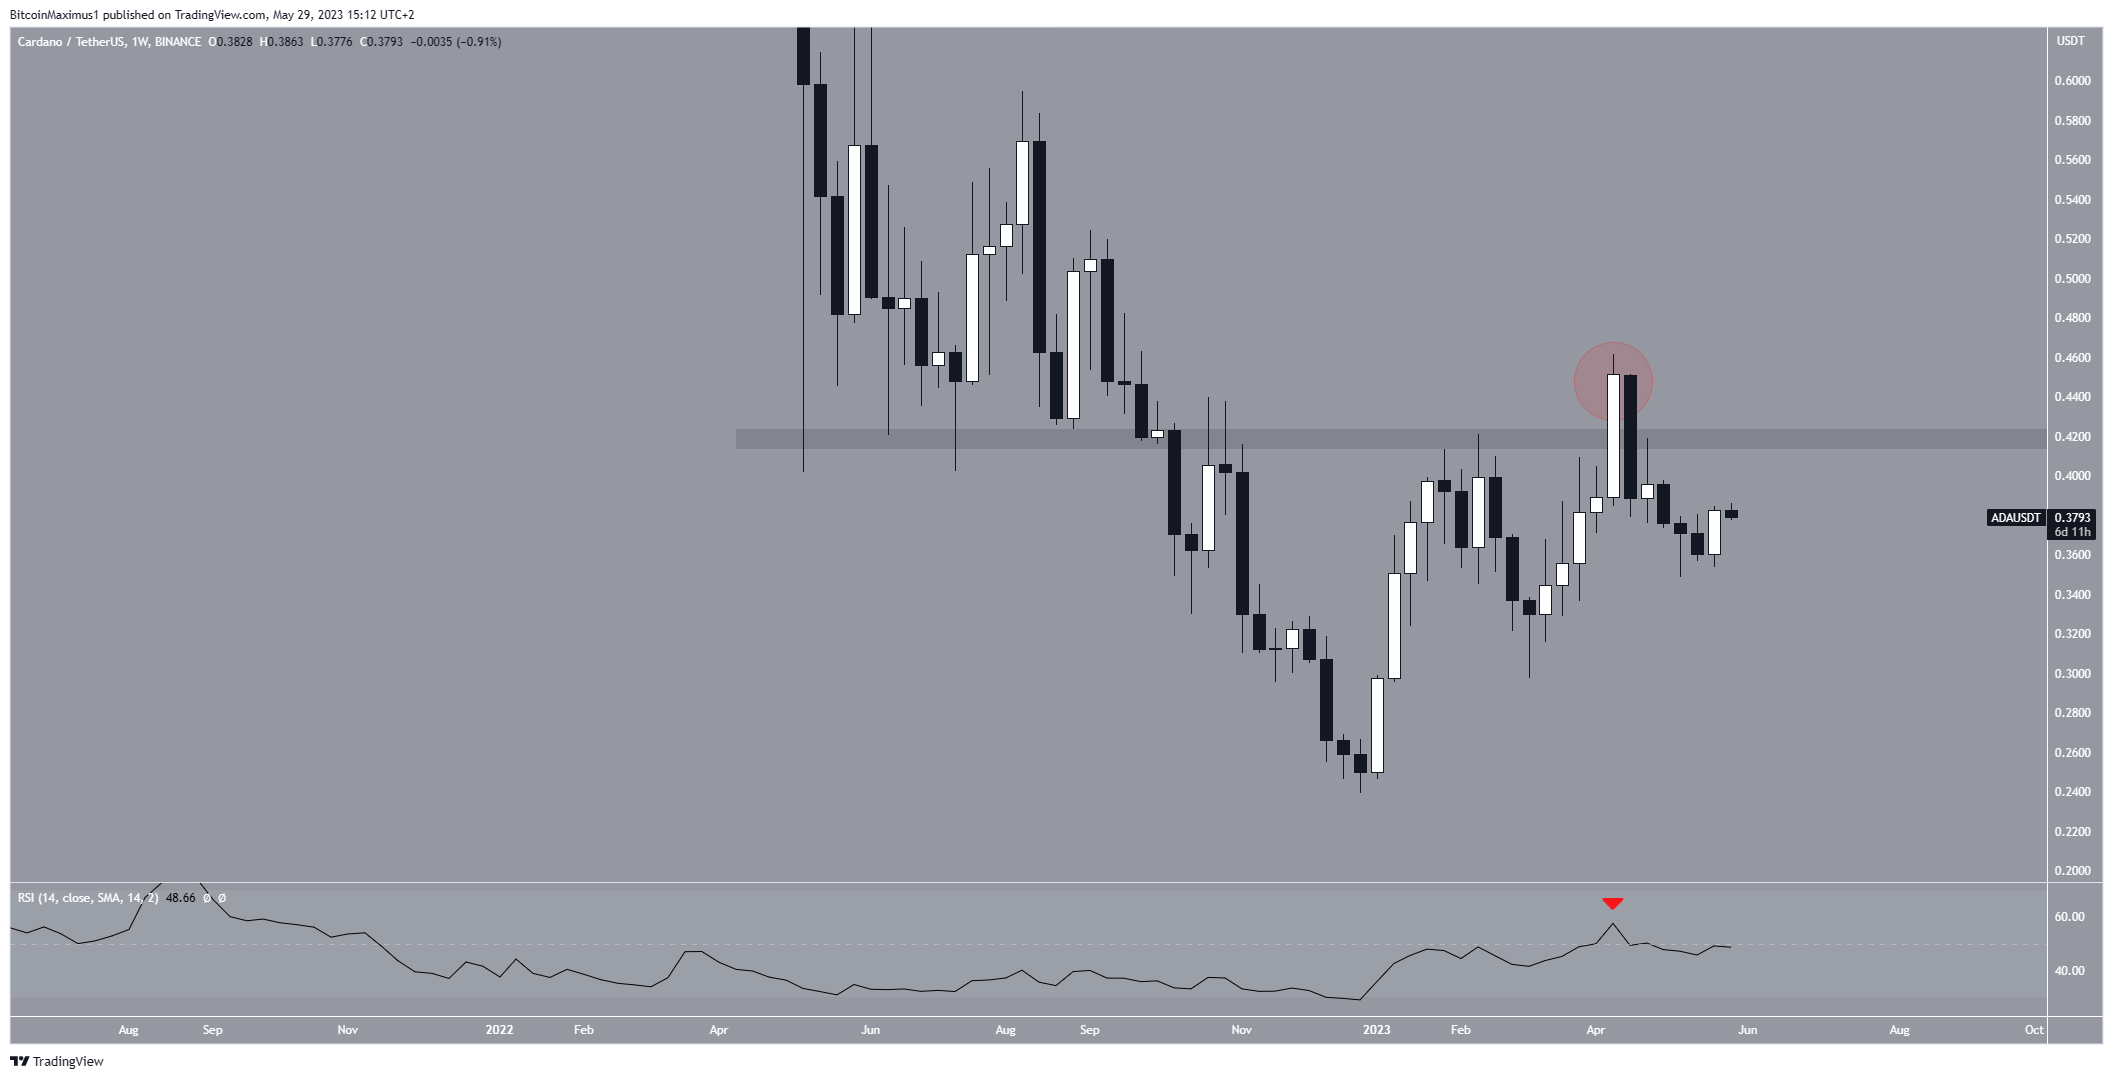
Additionally, the weekly Relative Strength Index (RSI) gives a bearish reading. Traders utilize the RSI as a momentum indicator to assess whether a market is overbought or oversold, and to determine whether to accumulate or sell an asset.
If the RSI reading is above 50 a
Go to Source to See Full Article
Author: Valdrin Tahiri
Tip BTC Newswire with Cryptocurrency
Donate Bitcoin to BTC Newswire

Donate Bitcoin Cash to BTC Newswire

Donate Ethereum to BTC Newswire

Donate Litecoin to BTC Newswire

Donate Monero to BTC Newswire

Donate ZCash to BTC Newswire


