
The Solana (SOL) price has fallen since reaching a new yearly high in July. It now trades considerably below the $27 horizontal resistance area.
The reaction to the $27 area will be crucial in determining if the future trend is bullish or bearish.
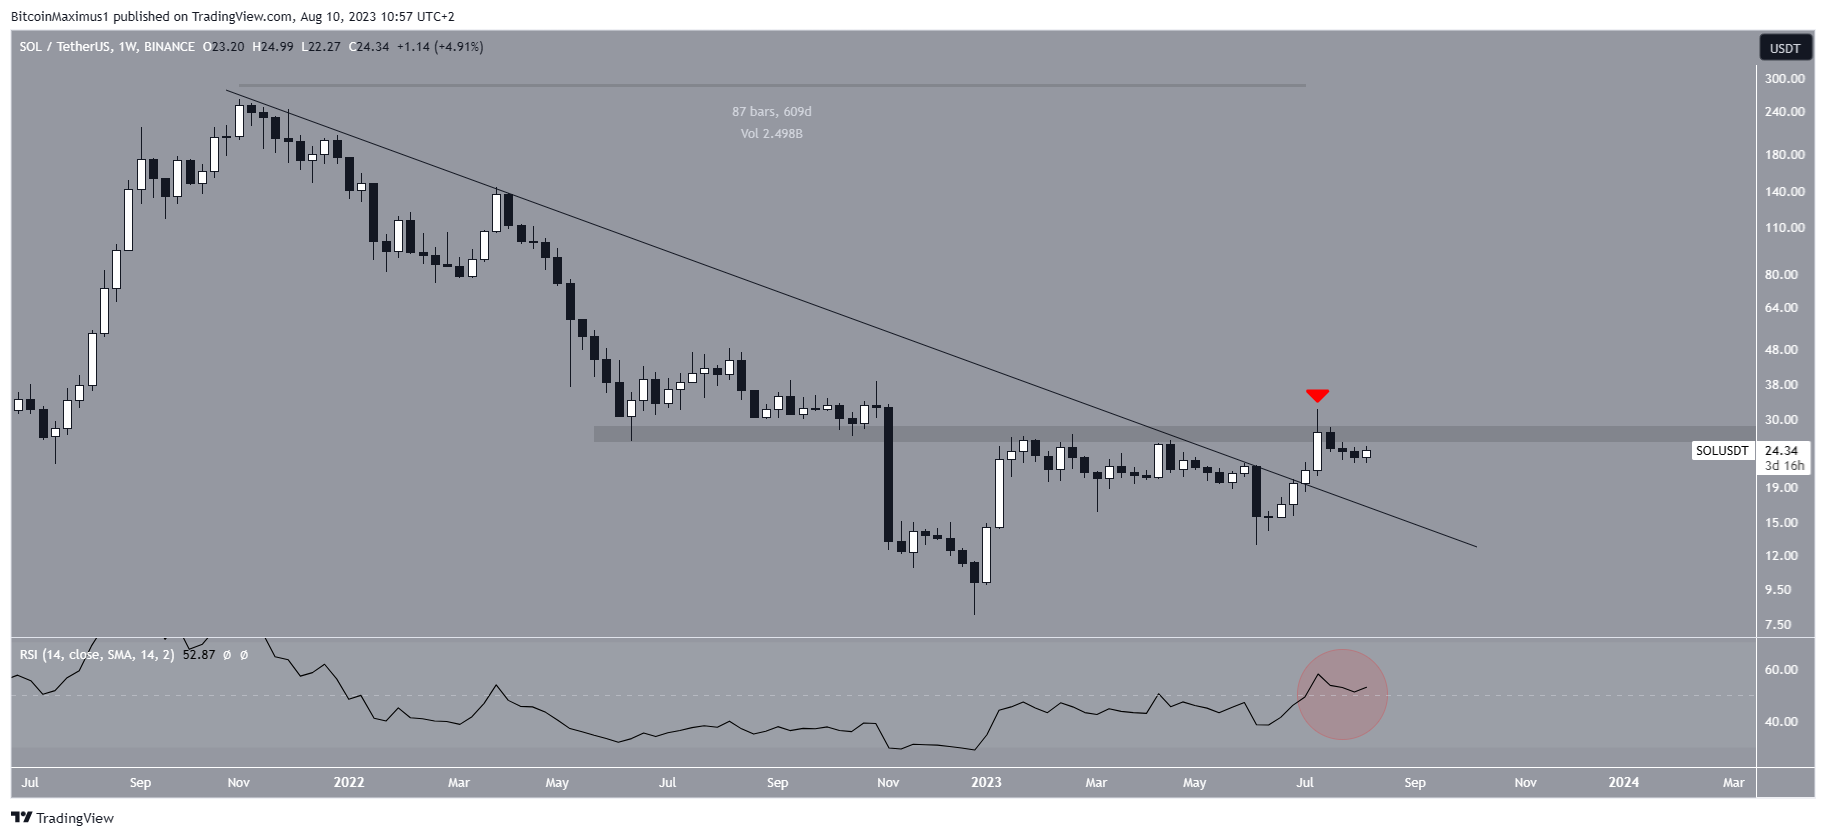
Solana Price Resumes Descent After Rejection
The weekly time frame technical analysis shows that the SOL price broke out from a long-term descending resistance line in July. The line had previously been in place for 609 days, tracing the downward movement since the all-time high in November 2022.
The SOL price failed to clear the $27 horizontal area despite breaking out. This created a long upper wick and validated the area as resistance. So, the bullish trend reversal will not be confirmed until the SOL price closes above this area.
The weekly RSI is leaning bullish and does not confirm the possibility of a bullish trend reversal. Traders utilize the RSI as a momentum indicator to assess whether a market is overbought or oversold and to determine whether to accumulate or sell an asset.
Go to Source to See Full Article
Author: Valdrin Tahiri
Tip BTC Newswire with Cryptocurrency
Donate Bitcoin to BTC Newswire

Donate Bitcoin Cash to BTC Newswire

Donate Ethereum to BTC Newswire

Donate Litecoin to BTC Newswire

Donate Monero to BTC Newswire

Donate ZCash to BTC Newswire


