The Shiba Inu (SHIB) token burn has reduced the circulating supply but has yet to have a noticeable effect on the price.
SHIB still trades below a long-term descending resistance trendline despite breaking out from a short-term channel.
Shiba Inu Consolidates in Long-Term Pattern
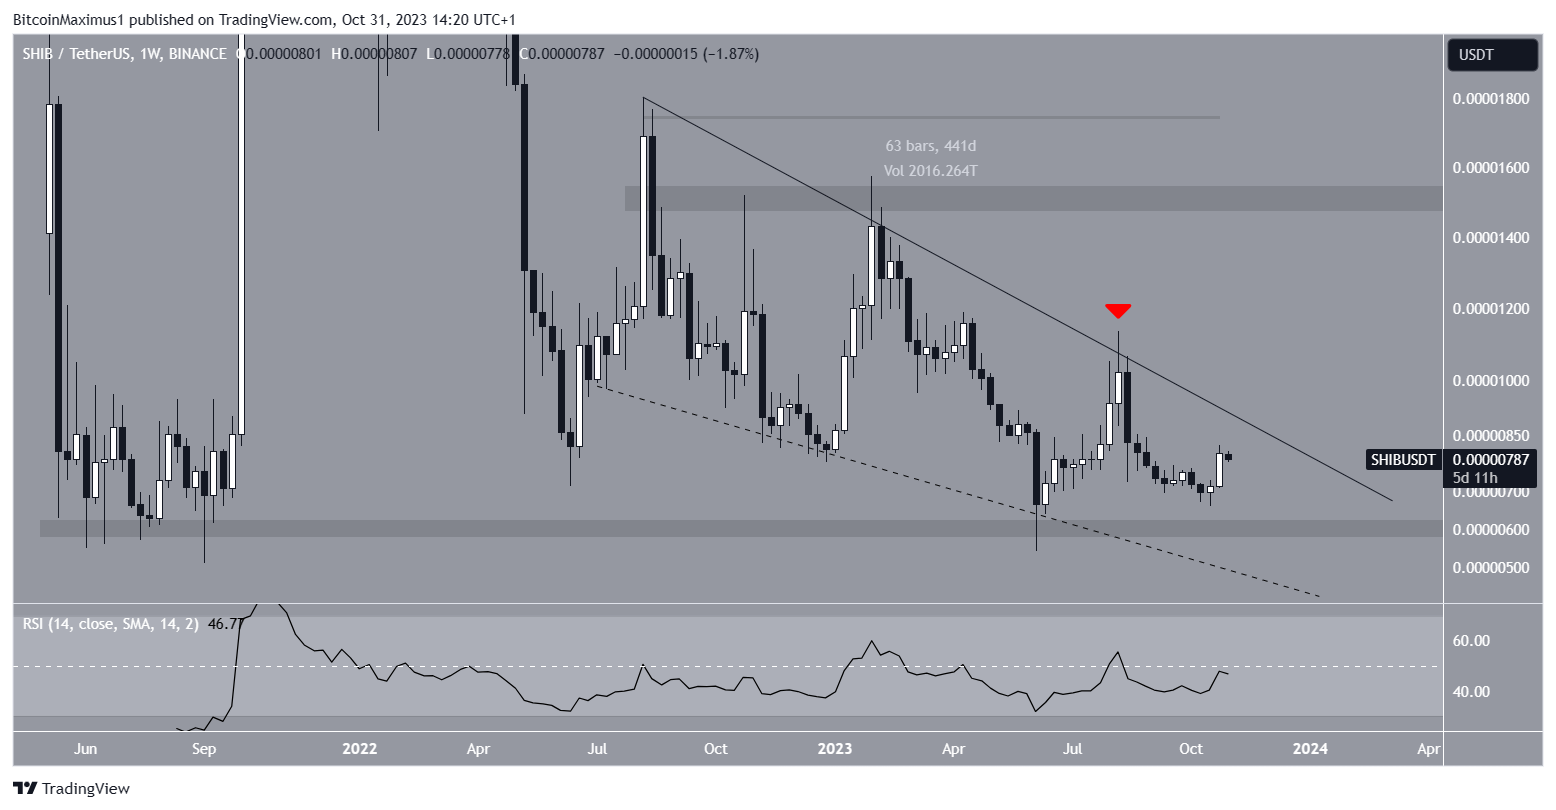
The weekly timeframe chart reveals that Shiba Inu’s price has declined below a descending resistance trendline since August 2022.
This trendline recently caused a rejection in August 2023 (red icon), leading to a further decline in SHIB’s price, which hit a low of $0.0000066 in October.
While there is a possibility that SHIB’s price is trading within a descending wedge, the support line (dashed) has not been validated sufficiently. The nearest horizontal support zone can be found at $0.0000060.
The Relative Strength Index (RSI), a crucial indicator for assessing market conditions, shows an undetermined reading for SHIB.
In general, when the RSI reading is above 50, and the trend is upward, bulls have the upper hand. Conversely, if the RSI reading falls below 50, the opposite holds true.
In the case of SHIB, the RSI is increasing but is below 50, a sign of an undetermined trend.

Go to Source to See Full Article
Author: Valdrin Tahiri


