
The Shiba Inu (SHIB) price has nearly reached the resistance trend line of a long-term pattern.
The price broke out from a short-term corrective pattern. Can this be the start of a new bullish rally?
Shiba Inu Nears Long-Term Resistance
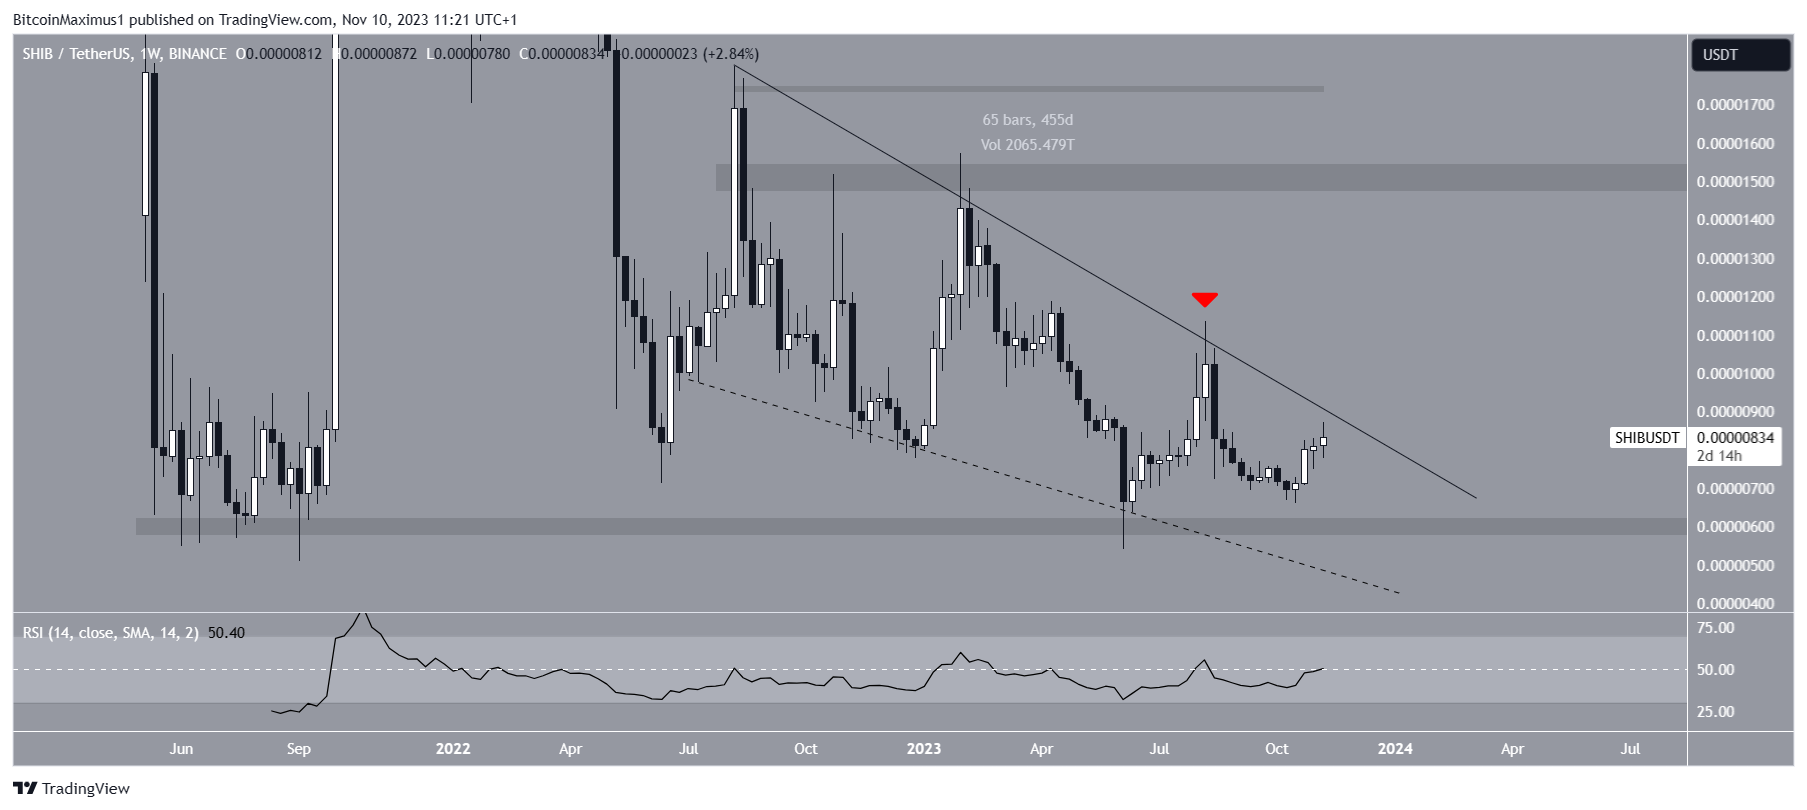
The weekly time frame technical analysis shows that the SHIB price has fallen under a descending resistance trend line since August 2022.
More recently, the trend line rejected the SHIB price in August (red icon), leading to a low of $0.0000066 in October.
The SHIB price could also be trading inside a descending wedge. However, its support line (dashed) has not been validated sufficient times. So, the SHIB price pattern is not confirmed yet.
Read more: Shiba Inu (SHIB) Price Predictions
Examining the Relative Strength Index (RSI), a crucial momentum indicator to analyze market conditions, it shows an uncertain reading for SHIB.
Typically, an RSI above 50 during an upward trend indicates bullish control, while an RSI below 50 suggests the opposite.
In the case of SHIB, the RSI is rising but remains below 50, indicating an undetermined trend.
Go to Source to See Full Article
Author: Valdrin Tahiri
Tip BTC Newswire with Cryptocurrency
Donate Bitcoin to BTC Newswire

Donate Bitcoin Cash to BTC Newswire

Donate Ethereum to BTC Newswire

Donate Litecoin to BTC Newswire

Donate Monero to BTC Newswire

Donate ZCash to BTC Newswire


