Disclaimer: The information presented does not constitute financial, investment, trading, or other types of advice and is solely the writer’s opinion.
- DOGE’s price action ranged between key Fibonacci levels.
- Tight margins in the derivatives market prevailed.
Dogecoin’s [DOGE] price action has been caught between key Fibonacci levels over a two-week period. With Bitcoin [BTC] back under $26k, the market could be primed for more losses in the short term.
How much are 1,10,100 DOGEs worth today?
However, memecoins have been known to deviate from the overall market direction. This could give either buyers/sellers an advantage, with DOGE primed for either a bullish or bearish breakout.
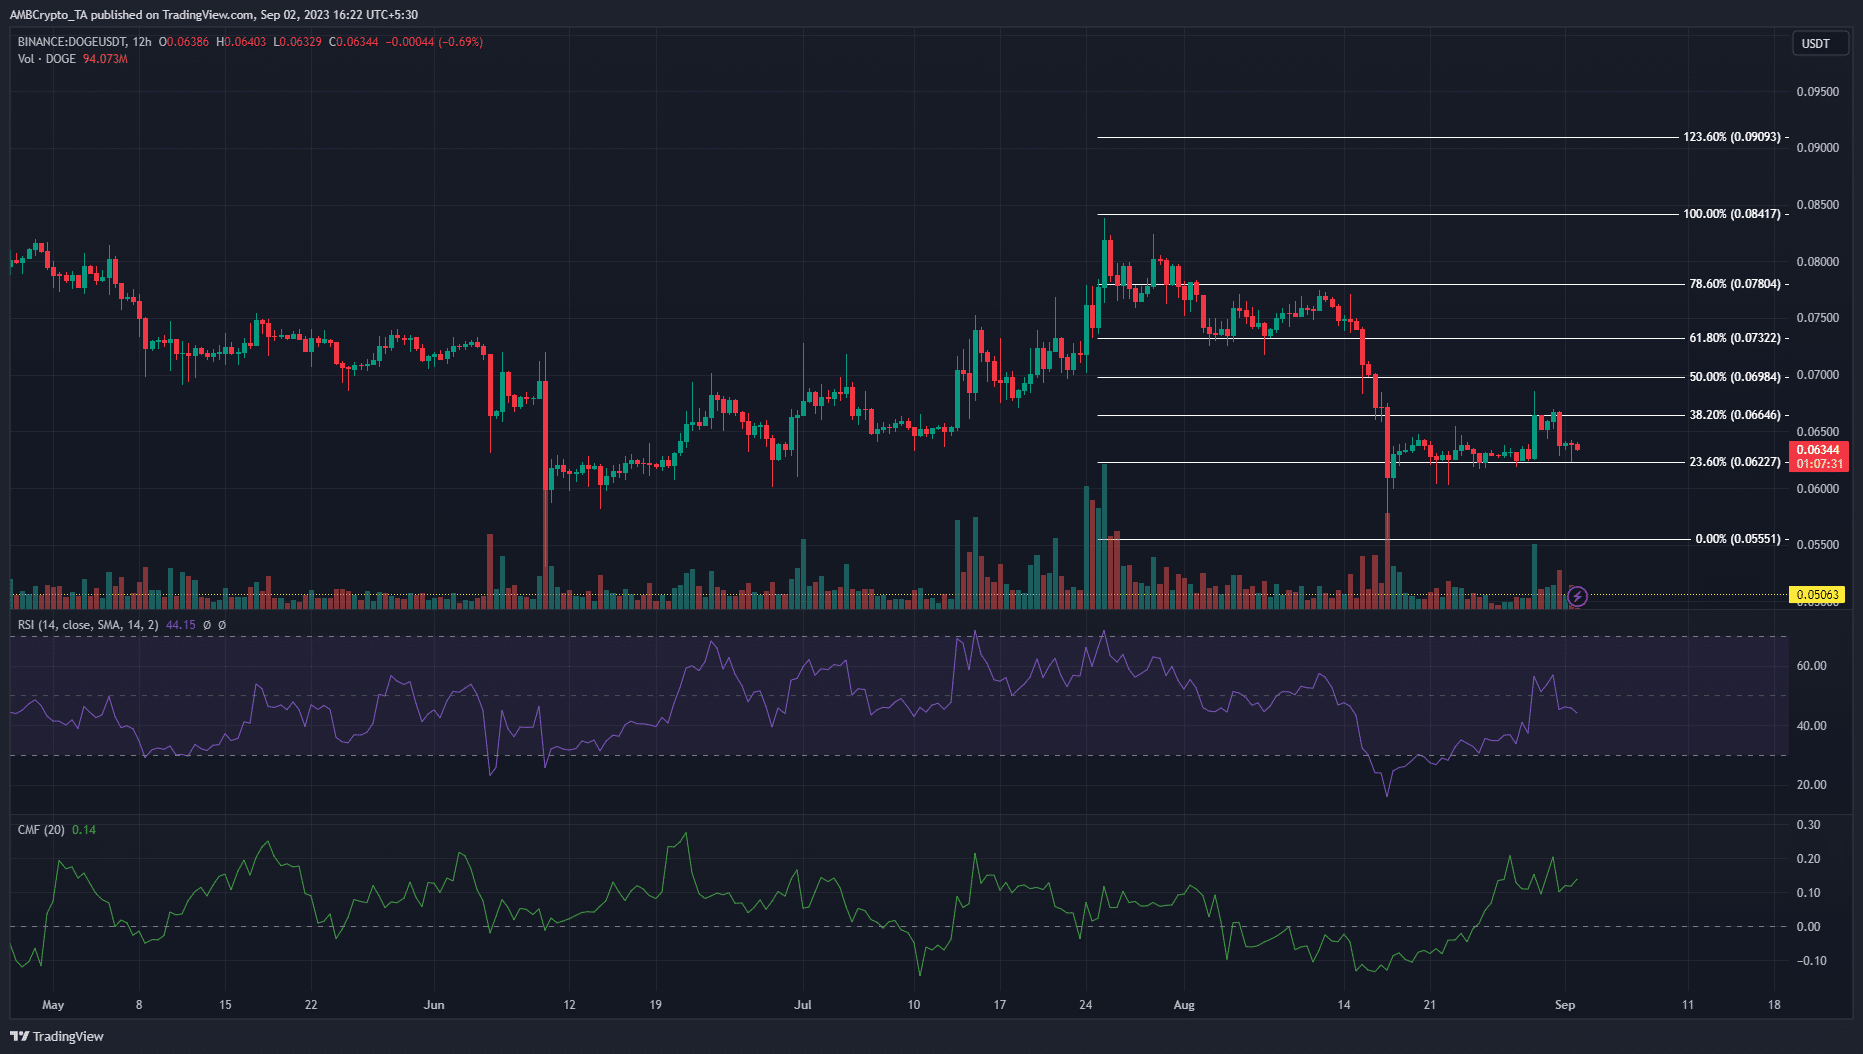
Fibonacci levels acted as dynamic support and resistance levels
Drawing the Fibonacci levels on the 12-hour timeframe showed a price tussle between bulls and bears.
Bulls made the 23.6% Fib level ($0.0622) a support level, with price unable to break below it. On the flip side, bears made the 38.2% Fib level ($0.0664) a resistance level, with buyers unable to push past it.
This price tussle intensified over the past five days, with buyers facing rejection at the 38.2% resistance level ($0.0664) on 29 August, while sellers faced pushback at the 23.6% support level ($0.0622) on 31 August.
The on-chart indicators flashed mixed signals. The Relative Strength Index (RSI) showed bears gaining the upper hand, with the RSI staying under neutral 50. However, the Chaikin Money Flow (CMF) hinted at bulls gaining the advantage with a reading of +0.15.
A break of the $0.0664 resistance level by bulls could see buyers target the $0.0700 to $0.0732 level. On the other hand, a break of th
Go to Source to See Full Article
Author: Suzuki Shillsalot
Tip BTC Newswire with Cryptocurrency
Donate Bitcoin to BTC Newswire

Donate Bitcoin Cash to BTC Newswire

Donate Ethereum to BTC Newswire

Donate Litecoin to BTC Newswire

Donate Monero to BTC Newswire

Donate ZCash to BTC Newswire


