Disclaimer: The information presented does not constitute financial, investment, trading, or other types of advice and is solely the writer’s opinion.
- Bitcoin flipped its daily market structure to bullish
- The defense of the $27k area is a key factor in gauging whether bulls possess enough steam to drive prices higher
Bitcoin [BTC] appeared to change its fortunes over the past three weeks. The drop to the range low of $24.9k on 11 September was followed by a rally that reached the mid-range resistance at $28.5k. The market structure was bullish on the 1-day chart- but can the bulls sustain this pressure?
Read Bitcoin’s [BTC] Price Prediction 2023-24
A Bitcoin price report from AMBCrypto dated 3 October noted the liquidity around the $27k region was an ideal place for prices to revisit. The insight from the liquidation charts proved accurate. The article also showed a move to $29k before a drop to $27k was possible for BTC, but this scenario didn’t pan out.
The revisit to a lower timeframe support zone could be followed by another leg upward for BTC
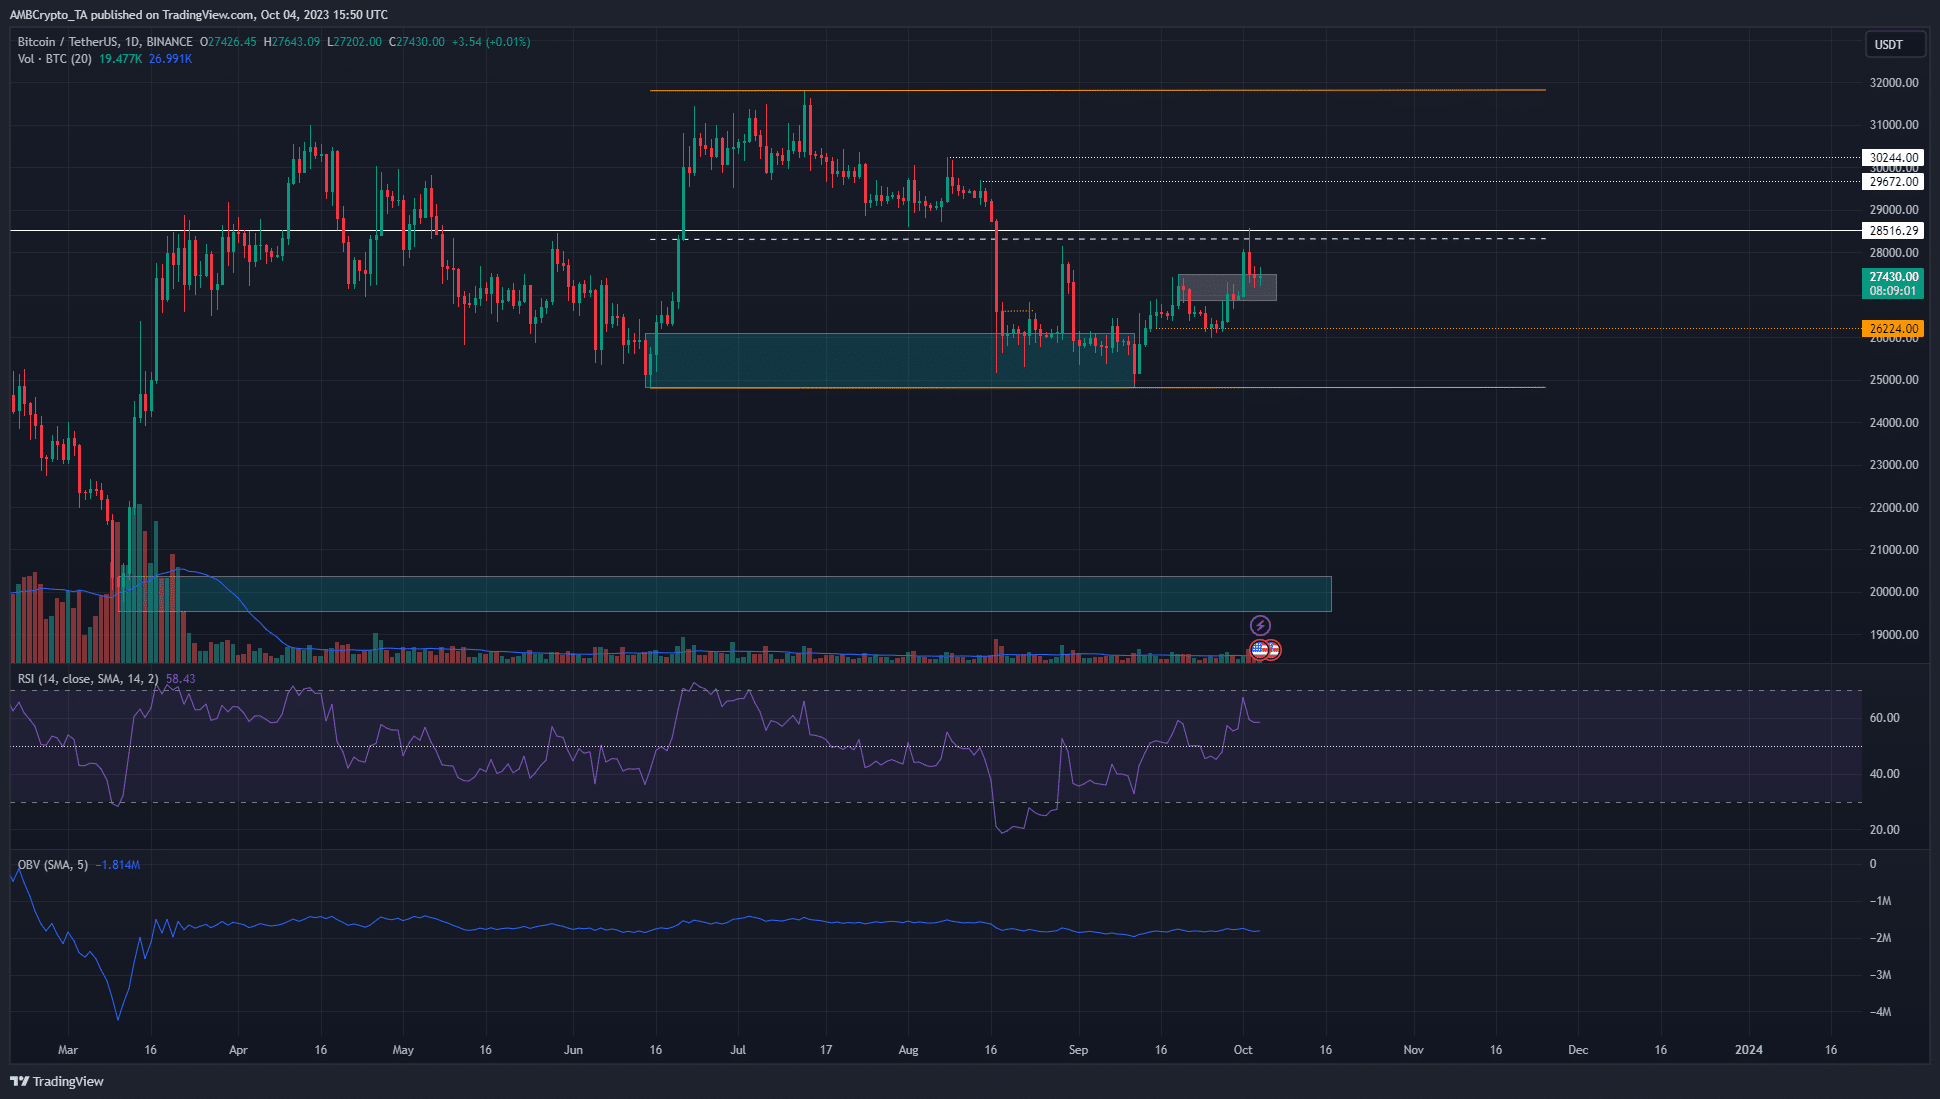
The range (orange) extended from $24.8k to $31.8k. The bullish order block at the range low prompted the rally, and the $26.2k short-term resistance was flipped to support as well. The next zone of interest was the bullish breaker block from the 4-hour timeframe, demarcated by the white box.
It stretched from $26.9k to $27.5k and was retested as support in recent hours. It was likely to witness a bullish reaction in the coming days, as the Relative Strength Index (RSI) showed bullish momentum was back. The structure was also in favor of the buyers.
The On-Balance Volume (OBV) on the daily chart sa
Go to Source to See Full Article
Author: Akashnath S
Tip BTC Newswire with Cryptocurrency
Donate Bitcoin to BTC Newswire

Donate Bitcoin Cash to BTC Newswire

Donate Ethereum to BTC Newswire

Donate Litecoin to BTC Newswire

Donate Monero to BTC Newswire

Donate ZCash to BTC Newswire


