- Altcoin’s TD Sequential indicator flashed a buy signal on BONK’s daily chart
- Price charts highlighted the formation of a clear triangle pattern, indicative of a consolidation phase
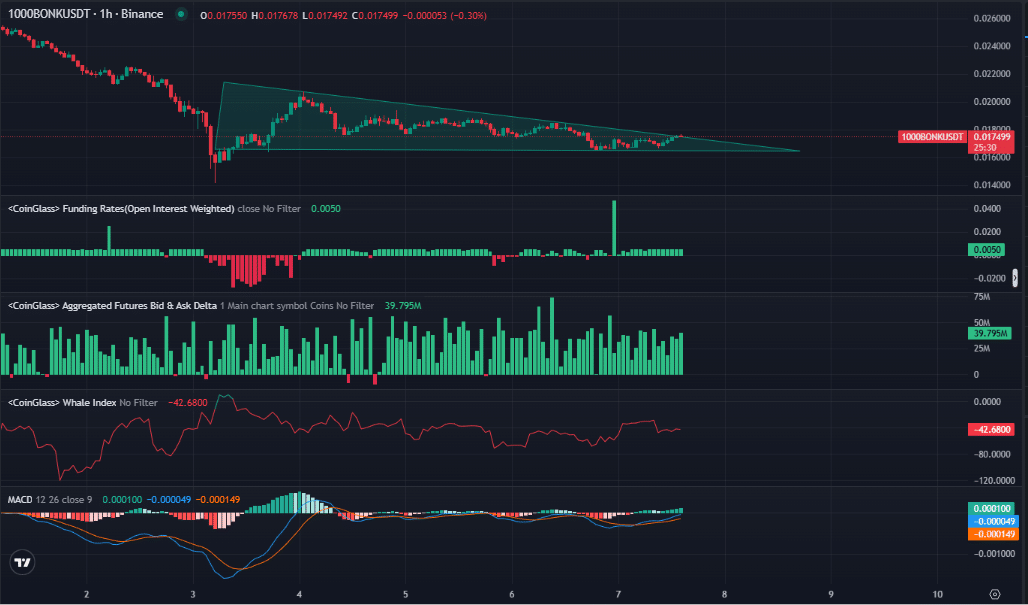
The cryptocurrency market offers both risks and opportunities for traders. BONK, for instance, has been registering signs of a potential price rebound on the charts lately. In fact, its TD Sequential indicator flashed a buy signal – A sign that a price rebound could be on the horizon.
Breaking through the triangle
According to AMBCrypto’s analysis, a clear triangle pattern seemed to be forming on the charts – Indicative of a consolidation phase before a breakout. In this phase, the price of BONK has been oscillating between a descending upper resistance and an ascending lower support, with the two lines converging towards the breakout point.
Usually, such patterns often hint at reduced volatility and greater potential for significant movement once the price breaks through either of these converging lines.
The recent crossover seen in the MACD indicator, with the MACD line crossing above the Signal line, also seemed to support the possibility of a bullish trend.
This crossover, combined with the consolidation triangle, suggested that momentum could be shifting in favor of the bulls – Reinforcing expectations of positive price movement on the charts.
A sign of change – Is BONK ready for a trend shift?
According to Ali on X, the TD Sequential indicator signaled “buy” on BONK’s daily chart. The TD Sequential is renowned for identifying exhaustion points in price trends, signaling potential reversals.

Go to Source to See Full Article
Author: Clinton Otieno